. 2009 Jul;175(1):25-35.
doi: 10.2353/ajpath.2009.080707. Epub 2009 Jun 4.

Development of a malignancy-associated proteomic signature for diffuse large B-cell lymphoma

Affiliations

Development of a malignancy-associated proteomic signature for diffuse large B-cell lymphoma

Paul B Romesser et al. Am J Pathol. 2009 Jul.

Abstract

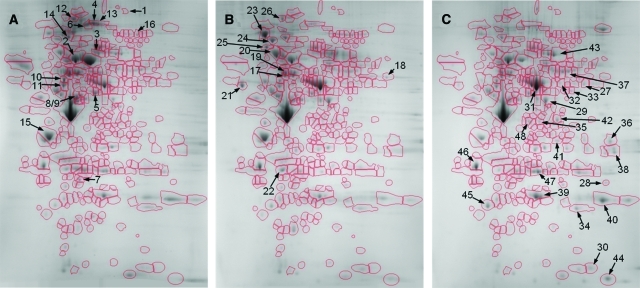
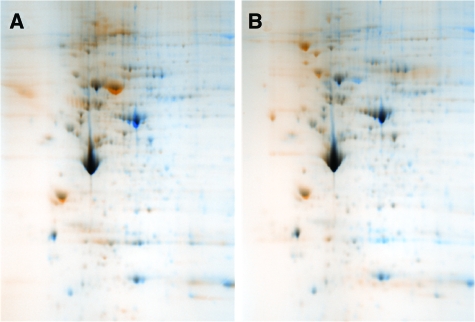
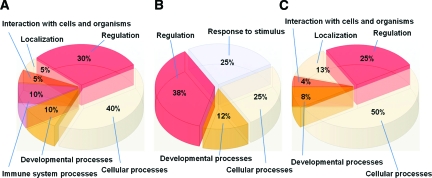
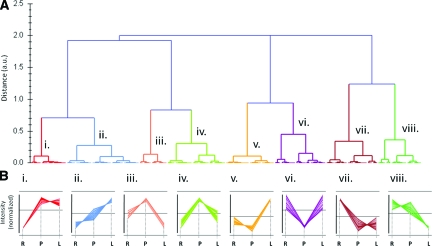
The extreme pathological diversity of non-Hodgkin's lymphomas has made their accurate histological assessment difficult. New diagnostics and treatment modalities are urgently needed for these lymphomas, particularly in drug development for cancer-specific targets. Previously, we showed that a subset of B cell lymphoma, diffuse large B cell lymphoma, may be characterized by two major, orthogonal axes of gene expression: one set of transcripts that is differentially expressed between resting and proliferating, nonmalignant cells (ie, a "proliferative signature") and another set that is expressed only in proliferating malignant cells (ie, a "cancer signature"). A differential proteomic analysis of B cell proliferative states, similar to previous transcriptional profiling analyses, holds great promise either to reveal novel factors that participate in lymphomagenesis or to define biomarkers of onset or progression. Here, we use a murine model of diffuse large B cell lymphoma to conduct unbiased two-dimensional gel electrophoresis and mass spectrometry-based comparative proteomic analyses of malignant proliferating B cells and tissue-matched, normal resting, or normal proliferating cells. We show that the expression patterns of particular proteins or isoforms across these states fall into eight specific trends that provide a framework to identify malignancy-associated biomarkers and potential drug targets, a signature proteome. Our results support the central hypothesis that clusters of proteins of known function represent a panel of expression markers uniquely associated with malignancy and not normal proliferation.


Figures

Figure 1
Figure 1
Example of 2D reference maps of resting, proliferating, and lymphoma B cell proteomes. Nuclear extract was isolated from spontaneous Tg B cell lymphomas, syngeneic resting splenic B cells, and B cells mitogenically stimulated to proliferate in culture. Lysate was subjected to desalting by size exclusion chromatography and then to 2D gel electrophoresis over the pI range of 3–10 and the molecular mass range of approximately 10 to 250 kd, followed by Coomassie staining. Gel images were warped, aligned and analyzed for changes in protein expression allowing for equivalent spot features defined across all data sets. A: Resting B cells. B: Normal, mitogenically stimulated, proliferating B cells. C: Proliferating lymphoma B cells. The gel region of approximately pI 4–9 (from left to right) and molecular mass 250 to 15 kd (from top to bottom) are shown, with spot features outlined and numbered according to the protein assignments reported in Table 1.
Figure 2
Figure 2
Comparative proteomic analysis of B cell proliferative states. Differential image analysis was conducted using warped and aligned 2D proteome reference maps for lymphoma B cells in comparison with normal resting and mitogenically stimulated, proliferating B cells. Overlapping areas of protein expression appear black while non-overlapping areas that are unique to each state are shown in color. A: Lymphoma B cells (blue) versus normal resting B cells (orange). B: Lymphoma B cells (blue) versus normal, mitogenically stimulated, proliferating B cells (orange).
Figure 3
Figure 3
Biological Process GO functional annotation of proteins dramatically up-regulated in each B cell proliferative state. Proteins assigned by matrix-assisted laser desorption ionization/time of flight MS and peptide mass fingerprint were annotated with GO functional tags and graphed to show the relative contributions of each functional assignment within the protein groups. Shown is the GO supercategory of Biological Process. A: Proteins up-regulated in normal resting B cells. B: Proteins up-regulated in normal, mitogenically stimulated, proliferating B cells. C: Proteins up-regulated in proliferating lymphoma B cells.
Figure 4
Figure 4
Expression difference profiling of protein spots between proliferative states. Gel spot feature intensity was quantified for each of the B cell proliferative states (Figure 1). Relative differences in expression levels between proliferative states were calculated and are shown plotted on a difference vector diagram, in which each spot feature is represented as a point with coordinates in the three intensity difference axes of resting, proliferating and lymphoma (reflecting its expression level difference for each state). The distance of the points from the origin (the point representing equivalent expression across all of the states) toward one set of axes or another quantitatively reflects the expression level bias of the protein spots they represent toward one or another state.
Figure 5
Figure 5
Hierarchical clustering of protein expression profiles across B cell proliferative states. Expression profiles of gel spot features were subjected to unsupervised clustering into expression trend groups. A: Dendrogram delineating the relatedness clusters of the expression profiles of the major sets of protein spots that varied between B cell proliferative states. Left axis, relatedness distance metric (in arbitrary units). Clusters at relatedness distance below the arbitrary value of 0.5 are labeled i–viii. B: Expression trends displayed by each cluster i-viii from A. Normalized spot intensities are graphed for each member of the cluster. R, normal resting B cells; P, normal mitogenically stimulated proliferating B cells; L, malignant proliferating lymphoma B cells. The average value for each cluster is shown in each graph by a horizontal line. Clusters i and vii represent a proliferative signature. Clusters ii, v, and viii represent potential malignancy-associated biomarkers.

References

    1. Edwards BK, Brown ML, Wingo PA, Howe HL, Ward E, Ries LAG, Schrag D, Jamison PM, Jemal A, Wu XC, Friedman C, Harlan L, Warren J, Anderson RN, Pickle LW. Annual report to the nation on the status of cancer, 1975–2002, featuring population-based trends in cancer treatment. J Natl Cancer Inst. 2005;97:1407–1427. - PubMed
    1. Ng AK. Diffuse large B cell lymphoma. Semin Radiat Oncol. 2007;17:169–175. - PubMed
    1. Illidge T, Tolan S. Current treatment approaches for diffuse large B cell lymphoma. Leukemia Lymphoma. 2008;49:663–676. - PubMed
    1. Alizadeh AA, Staudt LM. Genomic-scale gene expression profiling of normal and malignant immune cells. Curr Opin Immunol. 2000;12:219–225. - PubMed
    1. Alizadeh AA, Eisen M, Davis RE, C Ma, Lossos IS, Rosenwald A, Boldrick JC, Sabet H, Tran T, Yu X, Powell JI, Yang L, Marti GE, Moore T, Hudson J, Jr, Lu L, Lewis DB, Tibshirani R, Sherlock G, Chan WC, Greiner TC, Weisenburger DD, Armitage JO, Warnke R, Levy R, Wilson W, Grever MR, Byrd JC, Botstein D, Brown PO, Staudt LM. Distinct types of diffuse large-B cell lymphoma identified by gene expression profiling. Nature. 2000;403:503–511. - PubMed

Publication types

Substances