. 2009 Aug 15;332(2):309-24.
doi: 10.1016/j.ydbio.2009.05.575. Epub 2009 Jun 3.

Four distinct phases of basket/stellate cell migration after entering their final destination (the molecular layer) in the developing cerebellum

Affiliations

Four distinct phases of basket/stellate cell migration after entering their final destination (the molecular layer) in the developing cerebellum

D Bryant Cameron et al. Dev Biol. .

Abstract

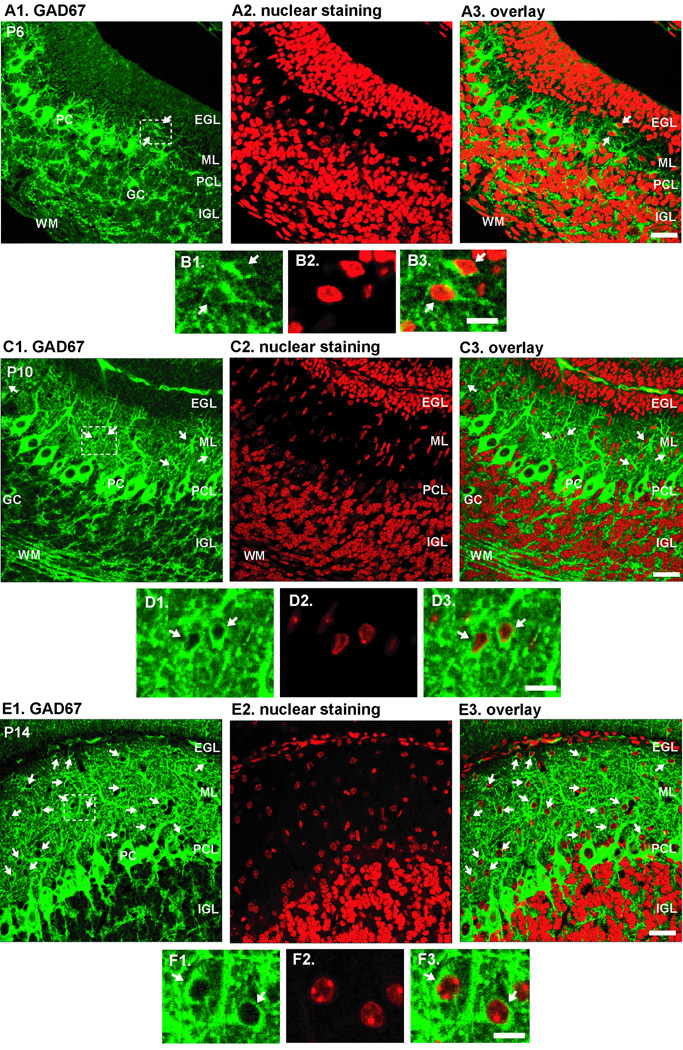
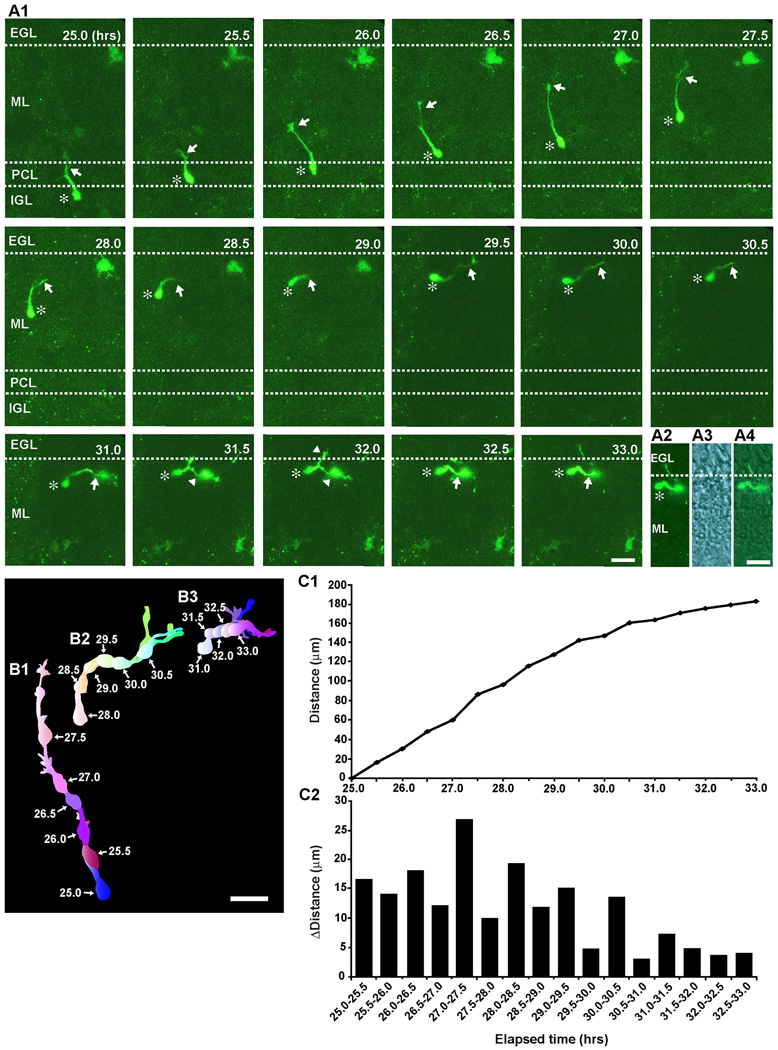
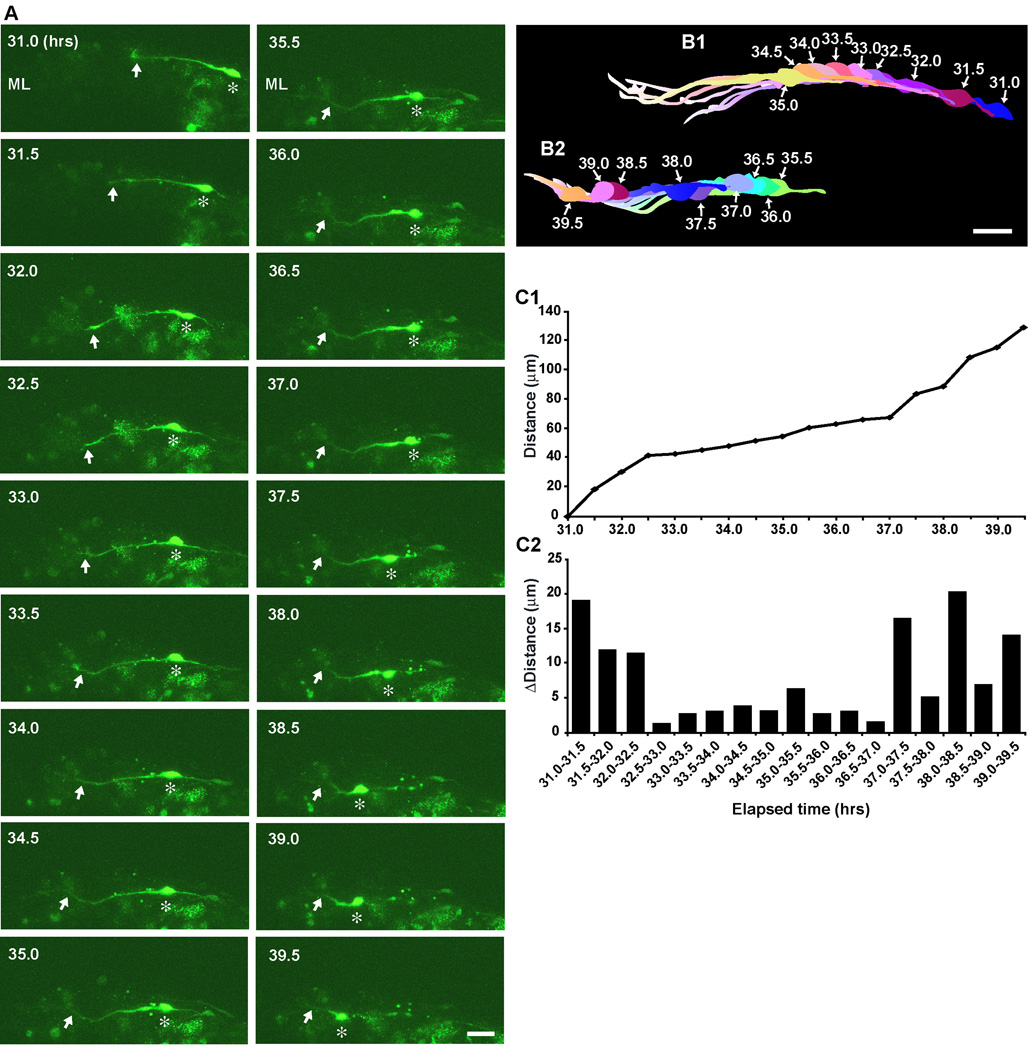
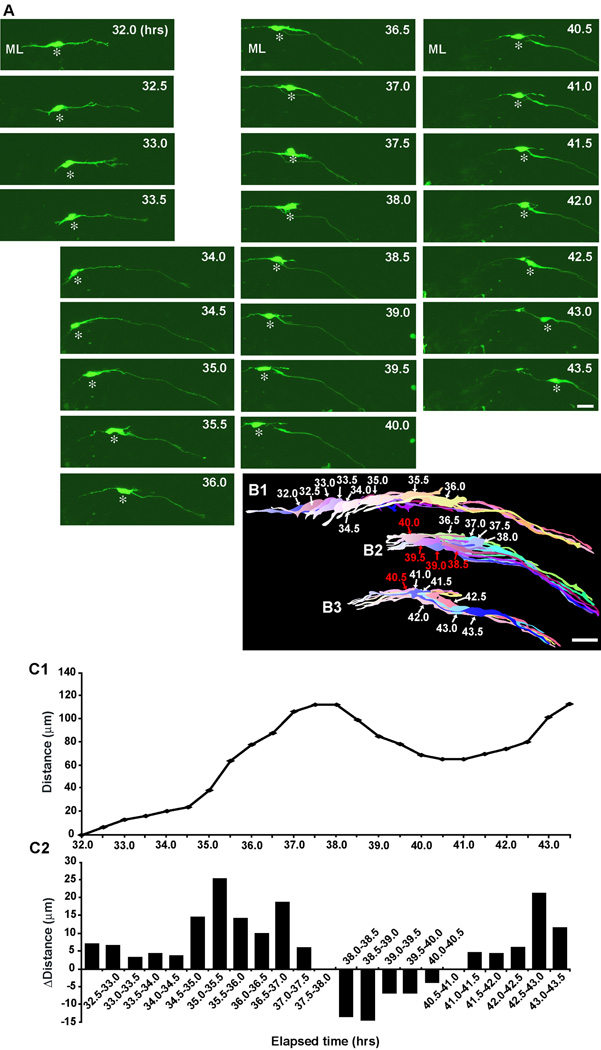
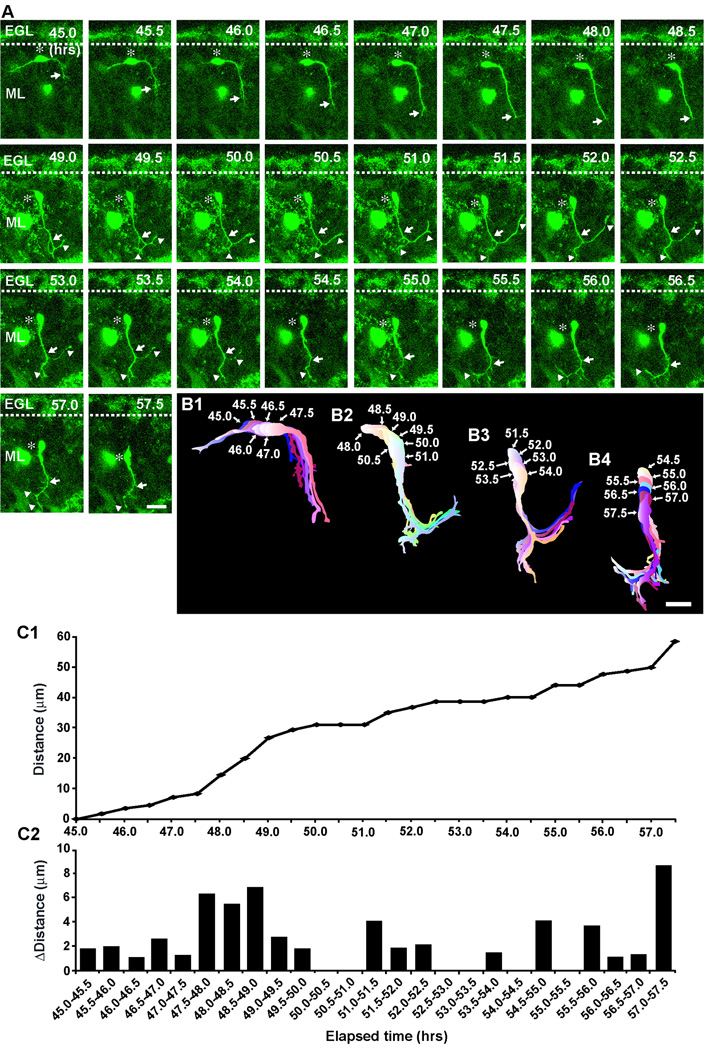
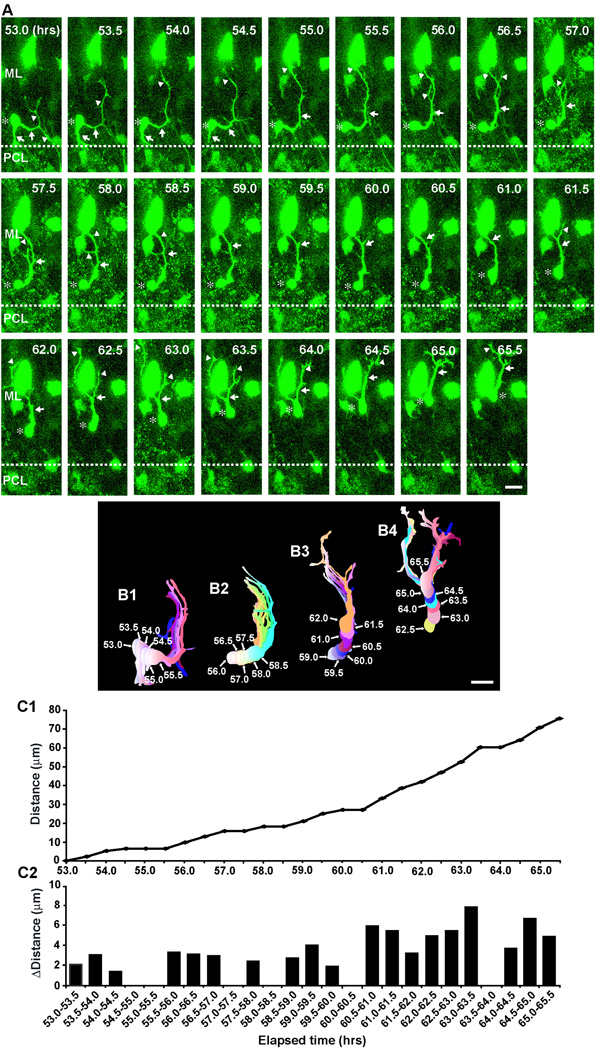
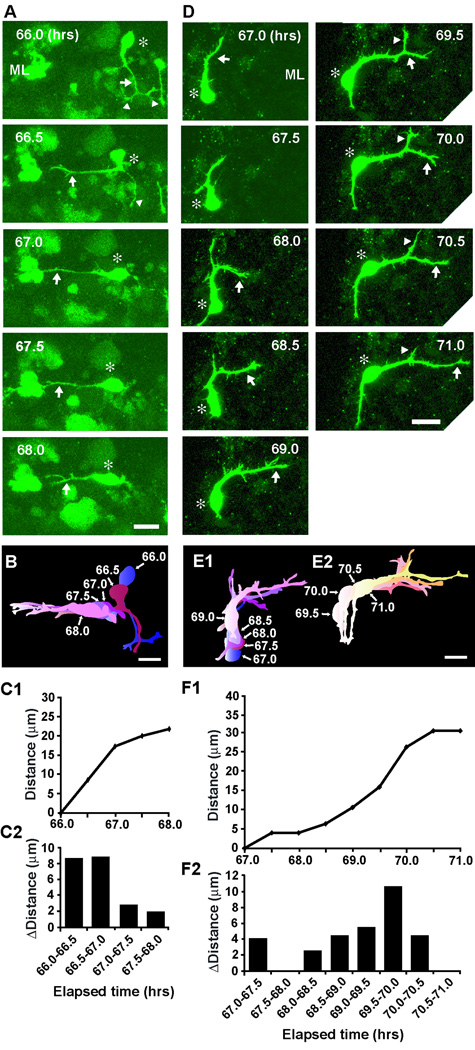
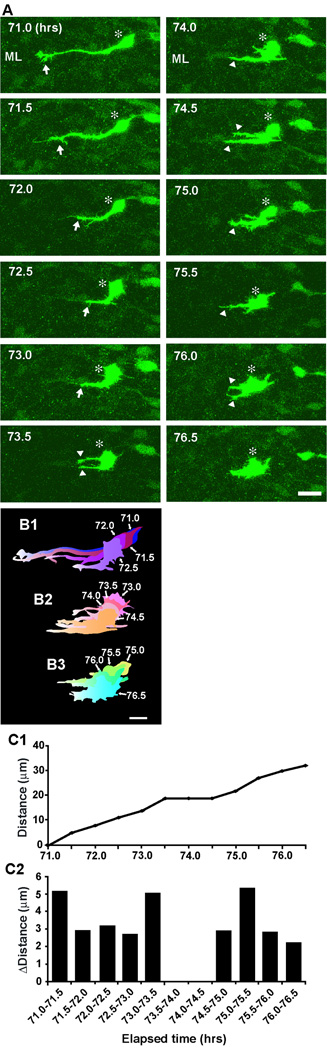
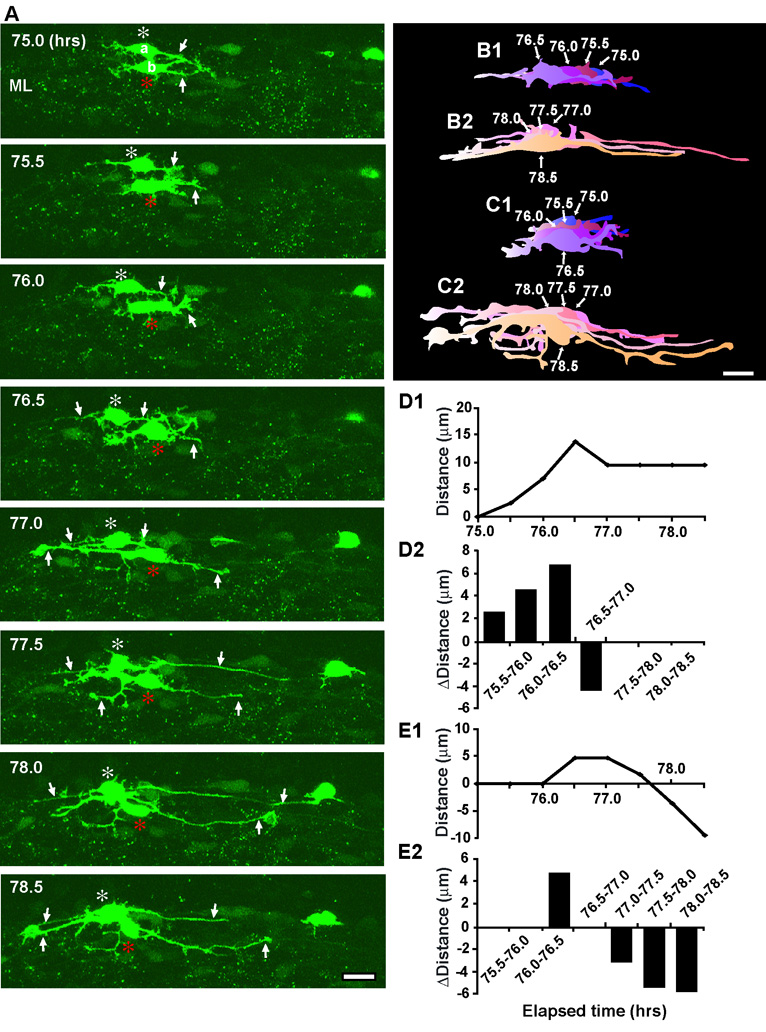
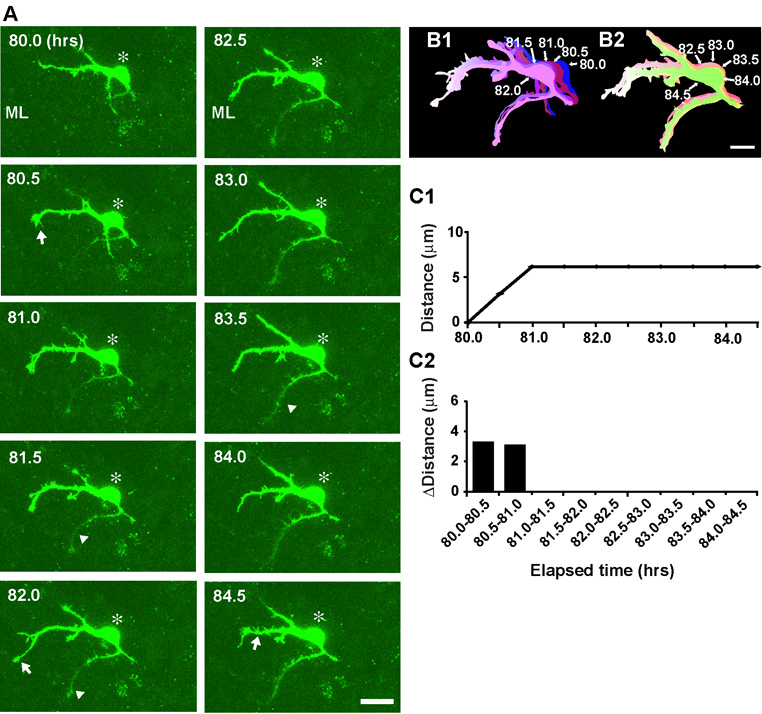
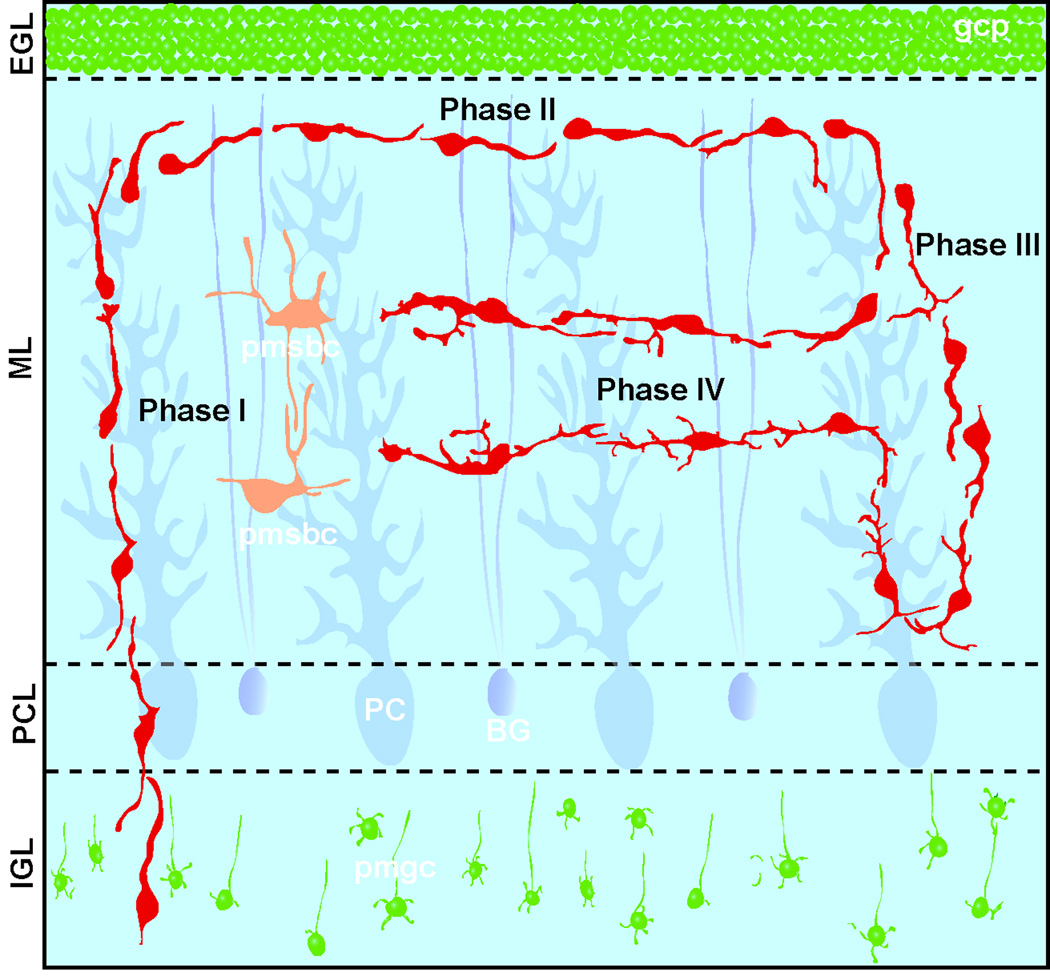
In the adult cerebellum, basket/stellate cells are scattered throughout the ML, but little is known about the process underlying the cell dispersion. To determine the allocation of stellate/basket cells within the ML, we examined their migration in the early postnatal mouse cerebellum. We found that after entering the ML, basket/stellate cells sequentially exhibit four distinct phases of migration. First, the cells migrated radially from the bottom to the top while exhibiting saltatory movement with a single leading process (Phase I). Second, the cells turned at the top and migrated tangentially in a rostro-caudal direction, with an occasional reversal of the direction of migration (Phase II). Third, the cells turned and migrated radially within the ML at a significantly reduced speed while repeatedly extending and withdrawing the leading processes (Phase III). Fourth, the cells turned at the middle and migrated tangentially at their slowest speed, while extending several dendrite-like processes after having completely withdrawn the leading process (Phase IV). Finally, the cells stopped and completed their migration. These results suggest that the dispersion of basket/stellate cells in the ML is controlled by the orchestrated activity of external guidance cues, cell-cell contact and intrinsic programs in a position- and time-dependent manner.


Figures

Fig. 1
Fig. 1
Expression of GAD67 in the early postnatal mouse cerebella. (A1, C1, E1) Expression of GAD67 in the sagittal sections of P6 (A1), P10 (C1) and P14 (E1) mouse cerebella, respectively. (A2, C2, E2) Nuclear staining of the sections presented in A1, C1, E1, respectively. (A3, C3, E3) Superimposed image of A1 and A2 (in A3), C1 and C2 (in C3), E1 and E3 (in E3), respectively. (B1–B3) Enlarged images of the boxed area presented in A1. (D1–D3) Enlarged images of the boxed area presented in C1. (F1–F3) Enlarged images of the boxed area presented in E1. Scale Bars (in µm): 60 (A3, C3, E3); 12 (B3, D3, F3). White arrows represent GAD-expressing stellate/basket cells in the ML. Abbreviations: EGL, external granular layer; Ml, molecular layer; PCL, Purkinje cell layer; IGL, internal granular layer; WM, white matter; PC, Purkinje cells, GC, Golgi cells
Fig. 2
Fig. 2
Radial migration of a stellate/basket cell from the top of the IGL through the PCL to the top of the ML, and subsequent change in the direction of migration from radial to tangential at the top of the ML. (A1) Time-lapse series of images showing the migration of a stellate/basket cell from the IGL through the PCL to the top of the ML of P9 mouse cerebellum. Elapsed time after in vitro (in hours) is indicated on the top-right of each photograph. Asterisks and arrows mark the soma and the leading process, respectively. Arrowheads represent the branch of the leading process. Scale bar; 24 µm. (A2-A4) Superimposed image (A4) of a fluorescent image (A2) and a transmitted image (A3) obtained at 32 hours after in vitro in A1. An asterisk marks the soma. A scale bar; 24 µm. (B1–B3) Pseudocolor images represent images of a stellate/basket cell taken every half hour shown in A1. Six images of the cell are superimposed in both B1 and B2, and five images are superimposed in B3. The numbers represent elapsed time after in vitro (in hours). Scale bar; 20 µm. (C1 and C2) The total distance traversed by the cell (C1) shown in A1 and the direction and distance traveled by the cell during each half hour of the testing period (C2) were plotted as a function of elapsed time after in vitro
Fig. 3
Fig. 3
Tangential migration of a stellate/basket cell at the top of the ML. (A) Time-lapse series of images showing the tangential migration of a stellate/basket cell at the top of the ML of P9 mouse cerebellum. Elapsed time after in vitro (in hours) is indicated on the top-left of each photograph. Asterisks and arrows mark the soma and the leading process, respectively. Scale bar; 25 µm. (B1 and B2) Pseudocolor images represent images of the stellate/basket cell taken every half hour shown in A. Nine images of the cell are superimposed in both B1 and B2. The numbers represent elapsed time after in vitro (in hours). Scale bar; 17 µm. (C1 and C2) The total distance traversed by the cell (C1) shown in A and the direction and distance traveled by the cell during each half hour of the testing period (C2) were plotted as a function of elapsed time after in vitro
Fig. 4
Fig. 4
Reversal of the direction of tangential migration of a stellate/basket cell at the top of the ML. (A) Time-lapse series of images showing the reversal of tangential migration of a stellate/basket cell at the top of the ML of P9 mouse cerebellum. Elapsed time after in vitro (in hours) is indicated on the top-right of each photograph. Asterisks mark the soma. Scale bar; 21 µm. (B1-B3) Pseudocolor images represent images of the stellate/basket cell taken every half hour shown in A. Nine images, eight images, and seven images of the cell are superimposed in B1, B2, and B3, respectively. The numbers represent elapsed time after in vitro (in hours). Scale bar; 22 µm. (C1 and C2) The total distance traversed by the cell (C1) shown in A and the direction and distance traveled by the cell during each half hour of the testing period (C2) were plotted as a function of elapsed time after in vitro. In C2, positive values represent tangential cell movement towards the rostral direction, while negative values represent tangential cell movement towards the caudal direction.
Fig. 5
Fig. 5
Alterations of the direction of stellate/basket cell migration from tangential to radial at the top of the ML. (A) Time-lapse series of images showing the change in the direction of stellate/basket cell migration in the ML of P10 mouse cerebellum. Elapsed time after in vitro (in hours) is indicated on the top right of each photograph. Asterisks mark the soma. Arrows and arrowheads represent the leading process of a stellate/basket cell and the branches, respectively. Scale bar; 20 µm. (B1–B4) Pseudocolor images represent images of the stellate/basket cell taken every half hour shown in A. Six images, seven images, six images, and seven images of the cell are superimposed in B1, B2, B3, and B4, respectively. The numbers represent elapsed time after in vitro (in hours). Scale bar; 22 µm. (C1 and C2) The total distance traversed by the cell (C1) shown in A and the direction and distance traveled by the cell during each half hour of the testing period (C2) were plotted as a function of elapsed time after in vitro
Fig. 6
Fig. 6
Turning of a stellate/basket cell at the bottom of the ML. (A) Time-lapse series of images showing the change of the direction of stellate/basket cell migration at the bottom of the ML of P10 mouse cerebellum. Elapsed time after in vitro (in hours) is indicated on the top right of each photograph. Asterisks mark the soma. Arrows and arrowheads represent the leading process of a stellate/basket cell and the branches, respectively. Scale bar; 15 µm. (B1-B4) Pseudocolor images represent images of the stellate/basket cell taken every half hour shown in A. Six images of the cell are superimposed in both B1 and B2, and seven images of the cell are superimposed in both B3 and B4. The numbers represent elapsed time after in vitro (in hours). Scale bar; 18 µm. (C1 and C2) The total distance traversed by the cell (C1) shown in A and the direction and distance traveled by the cell during each half hour of the testing period (C2) were plotted as a function of elapsed time after in vitro
Fig. 7
Fig. 7
Final turning of stellate/basket cells at the middle of the ML. (A and D) Time-lapse series of images showing the direction of stellate/basket cell migration from radial to tangential at the middle of the ML of P10 mouse cerebellum. Elapsed time after in vitro (in hours) is indicated on the top right of each photograph. Asterisks mark the soma. Arrows and arrowheads represent the leading processes of stellate/basket cells and their branches, respectively. Scale bars; 13 µm in A, and 15 µm in D. (B) Pseudocolor images represent images of the stellate/basket cell taken every half hour shown in A. Five images of the cell are superimposed in B. (E1 and E2) Pseudocolor images represent images of the stellate/basket cell taken every half hour shown in D. Five images of the cell are superimposed in E1, and four images of the cell are superimposed in E2. In B, E1 and E2, the numbers represent elapsed time after in vitro (in hours). Scale bars; 15 µm in B, and 14 µm in E1 and E2. (C1 and F1) The total distance traversed by the cell (C1) shown in A and the cell (F1) shown in D were plotted as a function of elapsed time after in vitro. (C2 and F2) The direction and distance traveled by the cell (C2) shown in A and the cell (F2) shown in D during each half hour of the testing period were plotted as a function of elapsed time after in vitro.
Fig. 8
Fig. 8
Initial sign of the completion of stellate/basket cell migration in the middle of the ML. (A)Time-lapse series of images showing the withdrawal of the leading process of stellate/basket cells at the middle of the ML of P10 mouse cerebellum. Elapsed time after in vitro (in hours) is indicated on the top left of each photograph. Asterisks mark the soma. Arrows and arrowheads represent the leading process of a stellate/basket cell and the neuronal processes, respectively. Scale bar; 12 µm. (B1-B3) Pseudocolor images represent images of the stellate/basket cell taken every half hour shown in A. Four images of the cell are superimposed in B1, B2 and B3, respectively. The numbers represent elapsed time after in vitro (in hours). Scale bar; 10 µm. (C1 and C2) The total distance traversed by the cell (C1) shown in A and the direction and distance traveled by the cell during each half hour of the testing period (C2) were plotted as a function of elapsed time after in vitro.
Fig. 9
Fig. 9
Extension of dendrite-like processes while migrating tangentially in the middle of the ML. (A) Time-lapse series of images showing the extension of dendrite-like processes from the somata of stellate/basket cells in the middle of the ML of P9 mouse cerebellum. Elapsed time after in vitro (in hours) is indicated on the top left of each photograph. White and red asterisks mark the somata of two stellate/basket cells (a and b), respectively. Arrows represent the dendrite-like processes. Scale bar; 13 µm. (B1 and B2) Four images of the cell (marked by a in A) are superimposed in both B1 and B2, respectively. (C1 and C2) Four images of the cell (marked by b in A) are superimposed in both C1 and C2, respectively. In B1, B2 and C1, C2, the numbers represent the elapsed time after in vitro (hours). Scale bar; 10 µm. (D1 and D2) The total distance traversed by the cell (D1) (marked by a in A) and the direction and distance traveled by the cell during each half hour of the testing period (D2) were plotted as a function of elapsed time after in vitro. (E1 and E2) The total distance traversed by the cell (E1) (marked by b in A) and the direction and distance traveled by the cell during each half hour of the testing period (E2) were plotted as a function of elapsed time after in vitro. In D2 and E2, positive values represent forward cell movement, while negative values represent backward cell movement.
Fig. 10
Fig. 10
Completion of stellate/basket cell migration at the middle of the ML. (A) Time-lapse series of images showing the completion of stellate/basket cell migration at the middle of the ML of P9 mouse cerebellum. Elapsed time after in vitro (in hours) is indicated on the top left of each photograph. Asterisks mark the soma. Arrows and arrowheads represent the dendrite-like processes. Scale bar; 11 µm. (B1 and B2) Pseudocolor images represent images of the stellate/basket cell taken every half hour shown in A. Five images of the cell in A are superimposed in both B1 and B2, respectively. The numbers represent elapsed time after in vitro (in hours). Scale bar; 10 µm. (C1 and C2) The total distance traversed by the cell (C1) in A and the direction and distance traveled by the cell during each half hour of the testing period (C2) were plotted as a function of elapsed time after in vitro.
Fig. 11
Fig. 11
Four distinct phases of basket/stellate cell migration in the ML of the developing cerebellum. Abbreviations: gcp, granule cell precursors; pmsbc, postmigratory stellate/basket cells; pmgc, postmigratory granule cells; BG, Bergmann glial cells; PC, Purkinje cells.

Similar articles

Cited by

References

    1. Adams NC, Tomoda T, Cooper M, Dietz G, Hatten ME. Mice that lack astrotactin have slowed neuronal migration. Development. 2002;129:965–972. - PubMed
    1. Altman J. Postnatal development of the cerebellar cortex in the rat. I. The external germinal layer and the transitional molecular layer. J. Comp. Neurol. 1972a;145:353–359. - PubMed
    1. Altman J. Postnatal development of the cerebellar cortex in the rat. II. Phases in the maturation of Purkinje cells and of the molecular layer. J. Comp. Neurol. 1972b;145:399–463. - PubMed
    1. Anderson SA, Marin O, Horn C, Jennings K, Rubenstein JLR. Distinct cortical migrations from the medial and lateral ganglionic eminences. Development. 2001;128:353–363. - PubMed
    1. Ang ESBC, Haydar TF, Gluncic V, Rakic P. Four-dimensional migratory coordinates of GABAergic interneurons in the developing mouse cortex. J. Neurosci. 2003;23:5805–5815. - PMC - PubMed

Publication types

LinkOut - more resources