. 2009 Jul 14;19(13):1096-101.
doi: 10.1016/j.cub.2009.05.031. Epub 2009 Jun 4.

Mechanical forces of fission yeast growth

Affiliations

Mechanical forces of fission yeast growth

Nicolas Minc et al. Curr Biol. .

Erratum in

  • Curr Biol. 2014 Jun 16;24(12):1436

Abstract

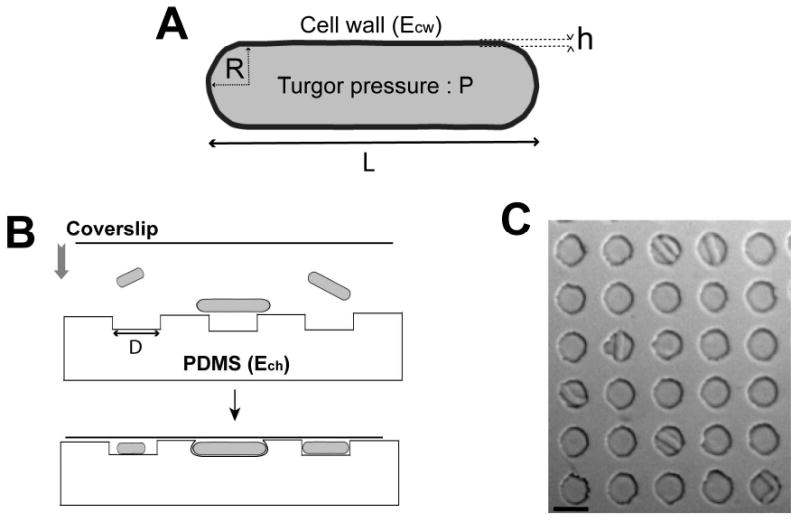
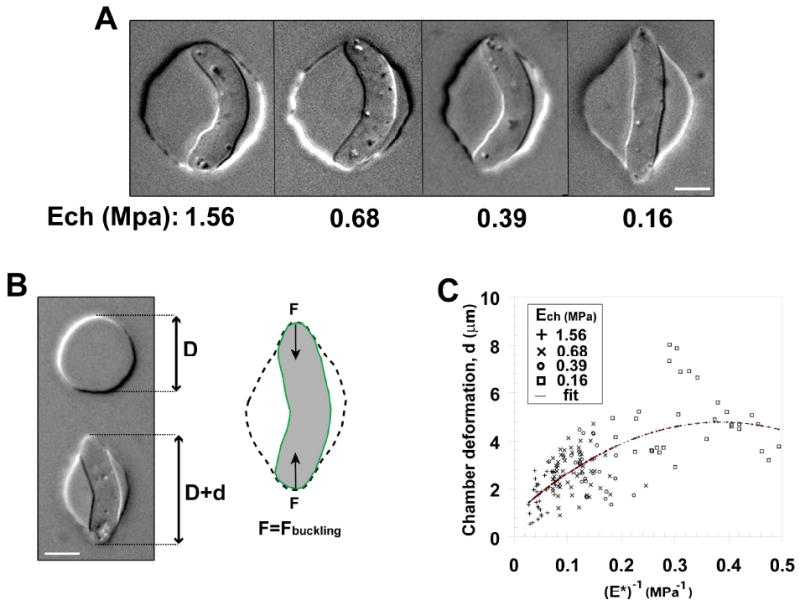
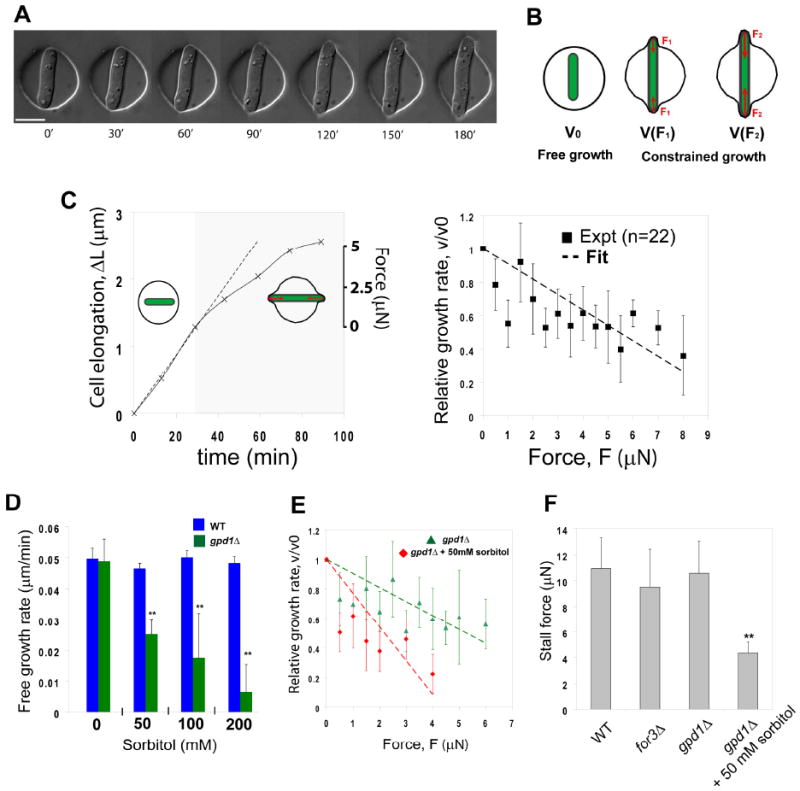
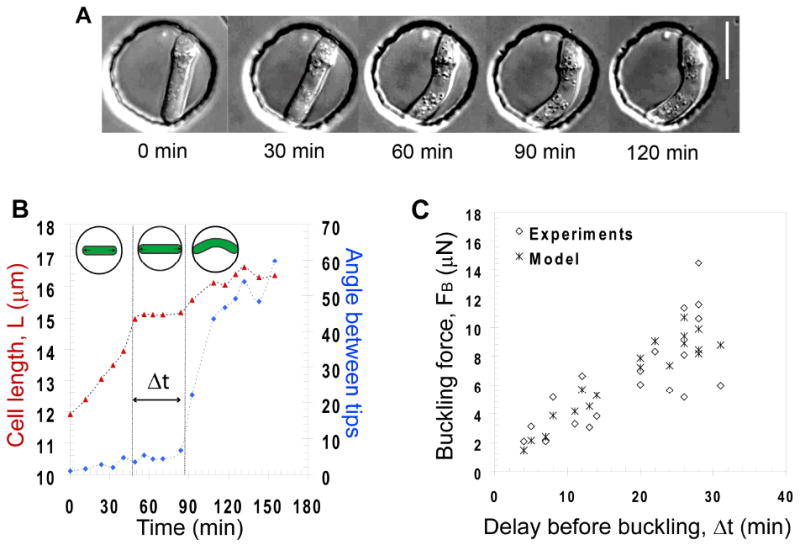
Mechanical properties contribute to the control of cell size, morphogenesis, development, and lifestyle of fungal cells. Tip growth can be understood by a viscoplastic model, in which growth is derived by high internal turgor pressure and cell-wall elasticity. To understand how these properties regulate growth in the rod-shaped fission yeast Schizosaccaromyces pombe, we devised femtoliter cylindrical polydimethylsiloxane (PDMS) microchambers with varying elasticity as force sensors for single cells. By buckling cells in these chambers, we determine the elastic surface modulus of the cell wall to be 20.2 +/- 6.1 N.m(-1). By analyzing the growth of the cells as they push against the walls of the chamber, we derive force-velocity relationships and values for internal effective turgor pressure of 0.85 +/- 0.15 MPa and a growth-stalling force of 11 +/- 3 muN. The behavior of cells buckling under the force of their own growth provides an independent test of this model and parameters. Force generation is dependent on turgor pressure and a glycerol synthesis gene, gpd1(+) (glycerol-3-phosphate dehydrogenase), and is independent of actin cables. This study develops a quantitative framework for tip cell growth and characterizes mechanisms of force generation that contribute to fungal invasion into host tissues.


Figures

Figure 1
Figure 1. Microfabricated chambers as single-cell force sensors for studying the mechanical properties of fission yeast cell
A) Parameters of a fission yeast cell. The cell wall layer has an elastic modulus, Ecw, and a thickness h. The turgor pressure inside the cell is P. The rod-shaped cell has a radius R and a length L. B) Schematic showing how yeast cells are placed into the PDMS chambers. C) Top-view image of several chambers with cells inside. Bar=10μm.
Figure 2
Figure 2. Measuring fission yeast cell wall elastic modulus
A) Single fission yeast cells with similar cell length were pushed into chambers smaller than the cells. Chambers with decreasing elastic moduli Ech (from left to right) are shown. Bars = 5μm. B) Illustration of the method used to compute chamber deformation. (Left) The initial chamber diameter, D, is measured on the surrounding chambers (precision better than 5%) and the deformation, d, is measured along the force axis. (Right) The force from the chamber deformation equilibrates the buckling force. Because this buckling force is proportional to the cell wall surface modulus, this method allows for a direct calculation of the cell wall surface modulus at the single cell level. Bar = 5μm. C) Plot of the chamber deformation as a function of the inverse of the scaled chamber elastic modulus (E*, see eq. 4) obtained from 155 single cells. Different symbols correspond to different chamber elastic moduli, as shown in the legend. The fit used is parabolic to account for second order saturations at larger deformation. The imprecision in the measurement is found to be higher than the scattering of the data around the proposed fit. The strain is NM11.
Figure 3
Figure 3. Force-velocity relations for fission yeast cell growth
A) Time-lapse sequence of a fission yeast cell growing in and deforming a chamber made of soft PDMS (elastic modulus = 0.16 Mpa). Bar=10μm. B) Schematic illustrating the basis of the experiments: the free growth rate, v0, is measured before the cell is deforming the chamber. When the cell deforms the chamber, the force from the deformation opposes turgor and may reduce the growth rate, v(F). As the cell deforms more and more the chamber, the force increases (F2>F1), which may continue changing the growth rate. C) Cell growth under an external force. (Left part) Examples of growth curves of a single cell growing in a stiff chamber (Ech=0.65MPa). The dotted lines follow the free growth rate as measured before contact. The gray part highlights the phase of growth under external force. The left axis plots the cell elongation: ΔL=L(t)-L(t=0). The right axis plots the external force of the deformed chamber. (Right part) Force-velocity plot. Each point is averaged on typically 3-4 different experimental sets, and forces are binned to keep a sample size almost constant. The vertical error bars represents the standard deviations. The dotted line plots a linear fit that correspond to eq. 5. D) Free growth rate measured in bipolar wild-type and gpd1Δ cells in the presence of increasing concentrations of sorbitol (0. 0.05, 0.1 and 0.2M). n=10 cells for each condition. E) Force-velocity plot of gpd1Δ cells in the absence and in the presence of 0.05M sorbitol. n=15 cells in both conditions. F) Stalling forces extrapolated from force-velocity curves in the indicated mutants and conditions. The yeast strains are: NM11, NM183 and NM209 (all in a cdc25-22 background and grown at 25C). ** Student T-test, P<0.005.
Figure 4
Figure 4. Cell buckling under its own pushing force
A) Time-lapse sequence of a fission yeast cell growing and buckling under its own pushing force in a rigid chamber. Bar=10μm. B) Example of a growth curve of a cell buckling in a 15μm chamber. The delay, Δt during which the cell length stalls is indicated. The angle between cell tips represented on the left axis in blue is used to detect the onset of buckling. C) Buckling force, FB plotted as a function of the delay, Δt, along with values predicted from the model. The yeast strains are NM11 and FC1234.

References

    1. Bastmeyer M, Deising HB, Bechinger C. Force exertion in fungal infection. Annu Rev Biophys Biomol Struct. 2002;31:321–341. - PubMed
    1. Boudaoud A. Growth of walled cells: from shells to vesicles. Phys Rev Lett. 2003;91:018104. - PubMed
    1. Harold FM. To shape a cell: an inquiry into the causes of morphogenesis of microorganisms. Microbiol Rev. 1990;54:381–431. - PMC - PubMed
    1. Slaughter B, Li R. Toward a molecular interpretation of the surface stress theory for yeast morphogenesis. Curr Opin Cell Biol. 2006;18:47–53. - PubMed
    1. Lockhart JA. An Analysis of Irreversible Plant Cell Elongation. Journal of Theoretical Biology. 1965;8:264–&. - PubMed

Publication types