. 2009 Jun 19;30(6):860-74.
doi: 10.1016/j.immuni.2009.04.012. Epub 2009 Jun 4.

A mutation in the Nlrp3 gene causing inflammasome hyperactivation potentiates Th17 cell-dominant immune responses

Affiliations

A mutation in the Nlrp3 gene causing inflammasome hyperactivation potentiates Th17 cell-dominant immune responses

Guangxun Meng et al. Immunity. .

Abstract

Missense mutations of the gene encoding NLRP3 are associated with autoinflammatory disorders characterized with excessive production of interleukin-1beta (IL-1beta). Here we analyzed the immune responses of gene-targeted mice carrying a mutation in the Nlrp3 gene equivalent to the human mutation associated with Muckle-Wells Syndrome. We found that antigen-presenting cells (APCs) from such mice produced massive amounts of IL-1beta upon stimulation with microbial stimuli in the absence of ATP. This was likely due to a diminished inflammasome activation threshold that allowed a response to the small amount of agonist. Moreover, the Nlrp3 gene-targeted mice exhibited skin inflammation characterized by neutrophil infiltration and a Th17 cytokine-dominant response, which originated from hematopoietic cells. The inflammation of Nlrp3 gene-targeted mice resulted from excess IL-1beta production from APCs, which augmented Th17 cell differentiation. These results demonstrate that the NLRP3 mutation leads to inflammasome hyperactivation and consequently Th17 cell-dominant immunopathology in autoinflammation.


Conflict of interest statement

Competing interestes statement: The authors declare that they have no competing financial interestes.

Figures

Figure 1
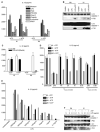
Figure 1. The inflammasome of NLRP3 KI BMDM is activated in the absence of ATP in a K+ efflux independent manner due to a lowered activation threshold
(A) BMDM from KI and Wt mice were stimulated with TLR ligands for 24 h, and pulsed with ATP for 1 h before harvesting where indicated. Mature IL-1β in culture supernatants was measure with ELISA. (B) Western blot analysis of cell lysates for detection of pro- and mature caspase-1. Lysates of cells without any treatment, ATP pulse (30min) or LPS priming (4 h) alone were included as controls. (C) ELISA measurement of IL-1β release from supernatants of KI and Wt BMDM stimulated with LPS as in (A), 50 mM KCl was incubated together with LPS for 24 h to deplete K+ efflux. (D) as in (C), with indicated amounts of Panx1 blocking peptide (10panx1) added at various time points before ATP pulse. (E) As in (C), except that cells were stimulated with various amounts of LPS as indicated. (F) As in (B), except that cells were stimulated with high (5ug/ml) or low (0.1ug/ml) amount of LPS overnight in the presence or absence of ATP pulse. Data are representative of four (A, B), three (C, E) and two (D, F) independent experiments.
Figure 2
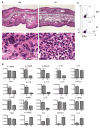
Figure 2. NLRP3 KI mice exhibited spontaneous skin inflammation
(A) Photos of NLRP3 KI and control mice at age of 12 weeks, showing severe inflammation in ear and face skin of knock-in mice. (B) H&E staining of skin tissue from inflamed NLRP3 KI or Wt mice. Upper panel, ear epidermis and dermis of KI mice are thickened due to inflammatory cell infiltration, in the severe case (upper left), the hypertrophic epidermis is intermittently eroded by infiltrated cells. Lower panel, high magnification of selected areas from upper panel showing that infiltrated cells in the KI tissue are mainly neutrophils. (C) Histologic analysis of cervical lymph node and spleen tissues of NLRP3 KI or control mice. GC, germinal center. RP, red pulp; WP, white pulp. (D) H&E staining of liver from inflamed NLRP3 KI or Wt mice. Livers from KI mice showed marked leukocyte infiltration (arrow head) in the protal areas (pv, protal vein), which resulted in loss of typical bile duct (bd) structure. (E) Flow cytometry of total cells from lymph nodes and spleen of KI and Wt mice upon neutrophil specific staining with 2 different antibodies as indicated. Filled peak, Wt; solid line, KI. Data are representative of three independent experiments.
Figure 3
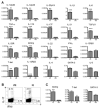
Figure 3. Th17 cytokines are dominant in inflamed skin tissue of KI mice
(A) Real time RT-PCR analysis for indicated cytokines and factors of RNA extracted from ears of KI mice that developed spontaneous inflammation or Wt mice, asterisk indicates statistical significance in comparison to Wt as follow: *, p<0.05; **, p<0.01; ***, p<0.001. (B) Flow cytometry of intracellular staining of IL-17 and IFNγ from lymph node CD4+ T cells of inflammed KI and Wt mice upon activation with PMA/ionomycin, numbers indicate frequences of IL-17 and IFNγ positive cells. (C) Real time RT-PCR analysis of indicated transcription factors in RNA extracted from CD4+ T cells from spleens of knock-in mice with inflammation or Wt mice; asterisk indicates statistical significance in comparison to Wt as follow: **, p<0.01. Data shown are mean ± S.D. (A, C) from a representative of four (A) or two (B, C) independent experiments.
Figure 4
Figure 4. Th17 cytokine is dominant in delayed type contact hypersensitivity (DTH) induced with DNCB from KI mice
(A) H&E staining of ear tissue from KI and Wt mice that developed inflammation upon DTH induction with DNCB. Upper panel, ear epidermal of both KI and Wt mice are thickened due to cell infiltration. Lower panel, high magnification of selected areas from upper panel showing that KI tissue was more heavily infiltrated with neutrophils. (B) Real time RT-PCR analysis for indicated cytokines and factors from inflamed ears of KI and Wt mice described in (A), asterisk indicates statistical significance in comparison to Wt as follow: *, p<0.05; **, p<0.01; ***, p<0.001. (C) Flow cytometry of lymph node CD4+ T cells from KI and Wt mice that developed contact hypersensitivity as in Figure 3B. Data shown are mean ± S.D. (B) from a representative of three independent experiments.
Figure 5
Figure 5. NLRP3 mutated Bone marrow reconstitution of Wt mice resulted in inflammasome hyperactivation and Th17 dominant skin inflammation
(A) ELISA measurement of IL-1β release from supernatants of BMDM from indicated bone marrow chimeric mice stimulated with indicated PAMPs as in Figure 1A. (B) Western blot analysis of BMDM mentioned in (A) for detection of pro- and mature IL-1β as in Figure 1B. (C) Real time RT-PCR analysis for indicated cytokines from inflamed ears of recipient mice receiving KI or Wt bone marrow cells, asterisk indicates statistical significance between the two samples as follow: **, p<0.01; ***, p<0.001. (D) Flow cytometry analysis of lymph node CD4+ T cells of mice described in (A) as in Figure 3B. Data shown are mean ± S.D. (C) from a representative of two independent experiments.
Figure 6
Figure 6. IL-1 from KI macrophages supports normal naïve CD4+ T cells differentiation into Th17 cells in the presence of TGFβ and IL-6
(A) (left) Flow cytometric studies of the intracellular expression of IL-17 and IFNγ from CD4+ T cells of Wt mice 4 days after culture in the presence of splenic CD11b+ cells from either KI or Wt mice at 3:1 (CD4+ : CD11b+) ratio with LPS or PGN stimulation. (right) Quantification of results at left panel depicted as the ratio between percentage of IL-17 and IFNγ producing cells in each sample, asterisk indicates statistical significance of IL-17/IFNγ between KI and Wt CD11 b+ macrophage incubated T cells as follow: **, p<0.01; ***, p<0.001. (B) (left) As in (A), except that either KI (upper two rows) or Wt (lower two rows) splenic CD11b+ cells were incubated with either Wt (1st and 3rd rows) or IL-1 receptor I deficient (IL1RI-/-) (2nd and 4th rows) CD4+ T cells as indicated. (right) Quantification of results from left panel depicted as IL-17/IFNγ as in (A), asterisk indicates statistical significance of IL-17/IFNγ between Wt and IL1RI-/- CD4+ T cells incubated with CD11b+ cells from either KI (upper panel) or Wt (lower panel) mice as follow: *, p<0.05. Data shown are mean ± S.D. from a representative of three independent experiments.
Figure 7
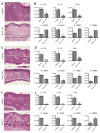
Figure 7. In vivo blockage of IL-1R1 and IL-17A decreased inflammation from KI mice
(A) Histologic analysis of ear skin sapmles from anti-IL-1R1 or isotype control Ab treated KI mice carrying spontaneous inflammation. Data shown is from representative one out of 3 mice treated in each group. (B) Tissue samples as in (A) was analyzed with Real time RT-PCR for indicated cytokines and receptors, asterisk indicates statistical significance in comparison to control Ab treated mice as follow: *, p<0.05; **, p<0.01. (C) H&E staining of ear tissues from KI mice treated with either anti-IL-1R1 or control Ab that developed inflammation upon DTH induction with DNCB. Data shown is from representative one out of 3 mice treated in each group. (D) The same samples as in (C) analyzed with Real time RT-PCR for indicated cytokines and receptors, asterisk indicates statistical significance in comparison to control Ab treated mice as follow: *, p<0.05; **, p<0.01; ***, p<0.001. (E) H&E staining of ear skin sapmles from either anti-IL-17 or isotype control Ab treated KI mice that carrying inflammation. Data shown is from representative one out of 3 mice treated in each group. (F) The same samples as in (E) analyzed with Real time RT-PCR for indicated cytokines and receptors, asterisk indicates statistical significance in comparison to control Ab treated mice as follow: *, p<0.05; **, p<0.01. Data shown are mean ± S.D. (B, D, F) from a representative of two independent experiments.

Comment in

References

    1. Aksentijevich I, DP C, Remmers EF, Mueller JL, Le J, Kolodner RD, Moak Z, Chuang M, Austin F, Goldbach-Mansky R, et al. The clinical continuum of cryopyrinopathies: novel CIAS1 mutations in North American patients and a new cryopyrin model. Arthritis and rheumatism. 2007;56:1273–1285. - PMC - PubMed
    1. Amadi-Obi A, Yu CR, Liu X, Mahdi RM, Clarke GL, Nussenblatt RB, Gery I, Lee YS, Egwuagu CE. TH17 cells contribute to uveitis and scleritis and are expanded by IL-2 and inhibited by IL-27/STAT1. Nature medicine. 2007;13:711–718. - PubMed
    1. Anderson JP, Mueller JL, Rosengren S, Boyle DL, Schaner P, Cannon SB, Goodyear CS, Hoffman HM. Structural, expression, and evolutionary analysis of mouse CIAS1. Gene. 2004;338:25–34. - PMC - PubMed
    1. Atarashi K, Nishimura J, Shima T, Umesaki Y, Yamamoto M, Onoue M, Yagita H, Ishii N, Evans R, Honda K, Takeda K. ATP drives lamina propria T(H)17 cell differentiation. Nature. 2008;455:808–812. - PubMed
    1. Chabaud M, Fossiez F, Taupin JL, Miossec P. Enhancing effect of IL-17 on IL-1-induced IL-6 and leukemia inhibitory factor production by rheumatoid arthritis synoviocytes and its regulation by Th2 cytokines. J Immunol. 1998;161:409–414. - PubMed

MeSH terms