. 2009 Aug 14;391(2):450-60.
doi: 10.1016/j.jmb.2009.05.085. Epub 2009 Jun 6.

The folding trajectory of RNase H is dominated by its topology and not local stability: a protein engineering study of variants that fold via two-state and three-state mechanisms

Affiliations

The folding trajectory of RNase H is dominated by its topology and not local stability: a protein engineering study of variants that fold via two-state and three-state mechanisms

Katelyn B Connell et al. J Mol Biol. .

Abstract

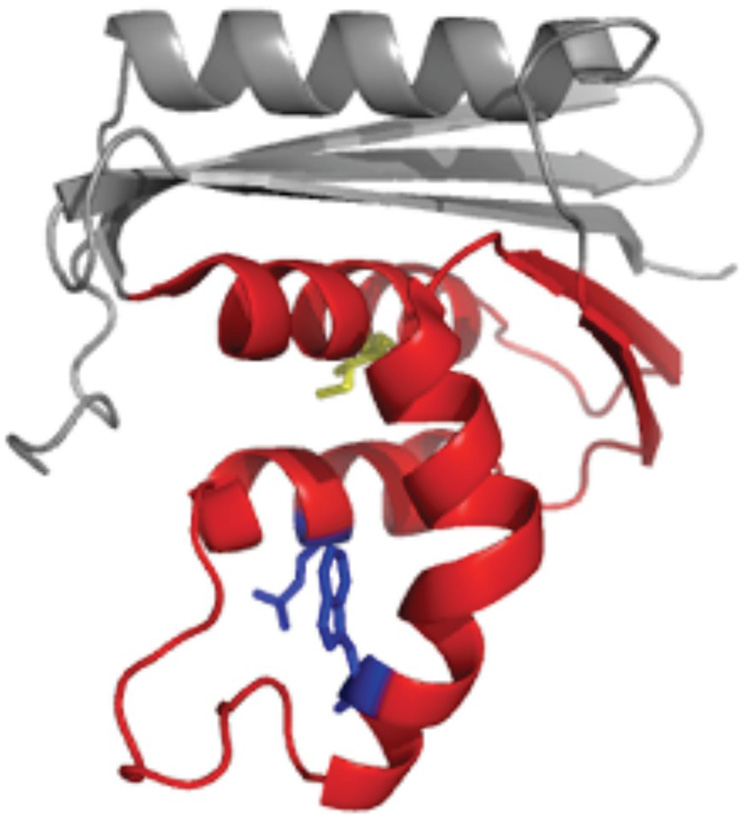
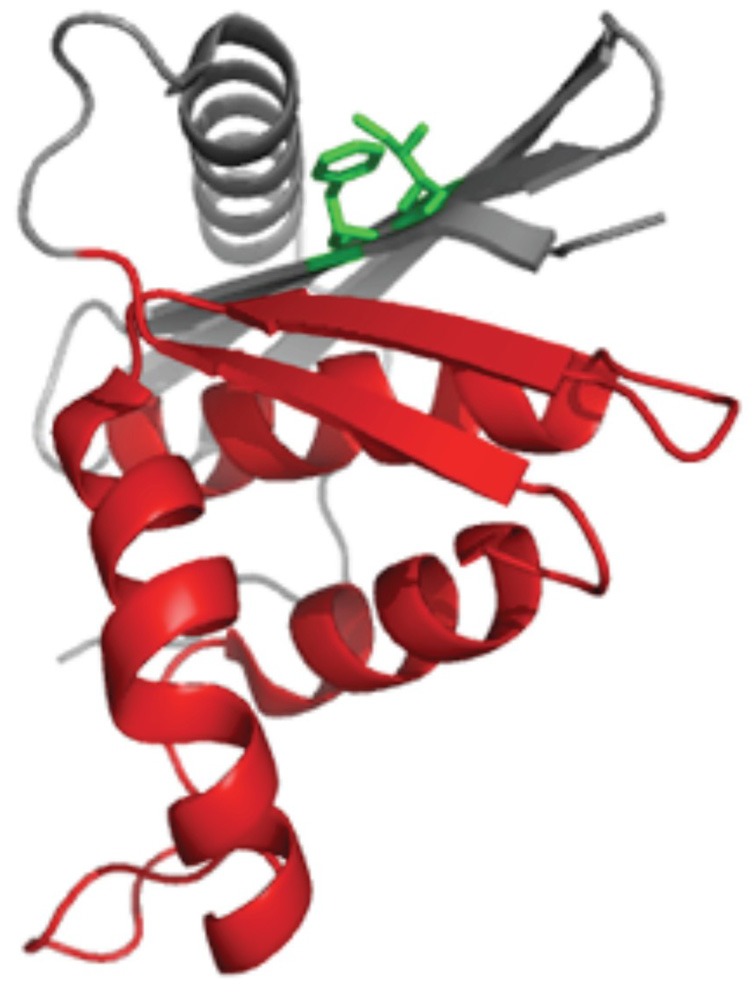
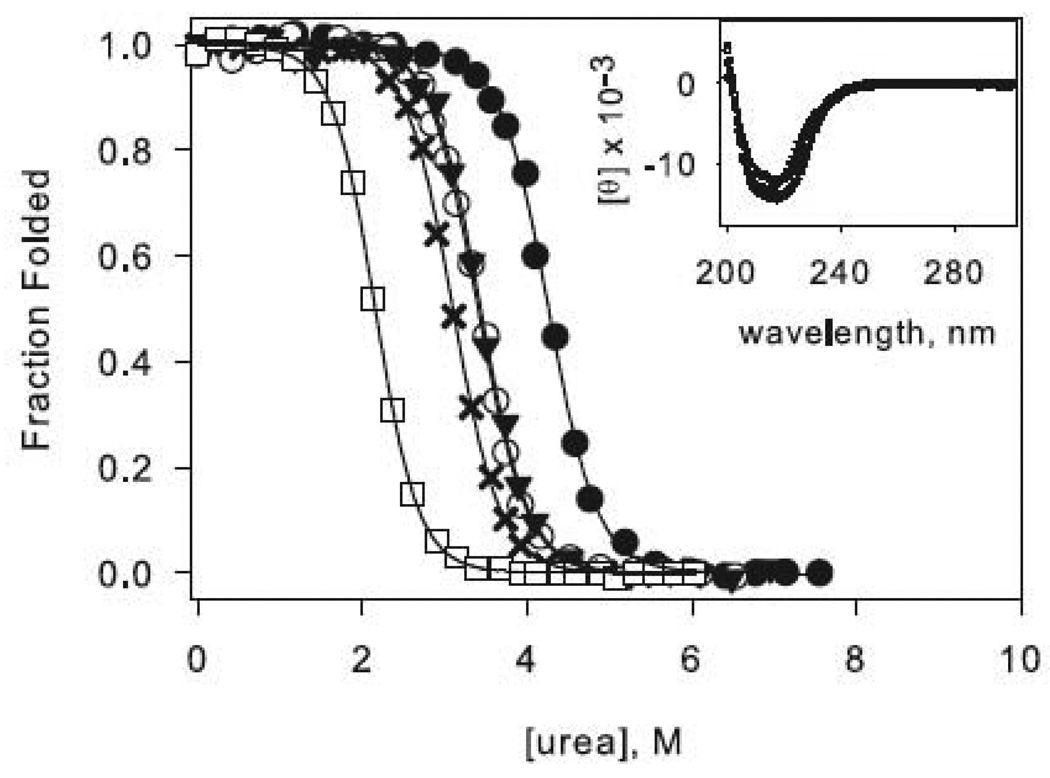
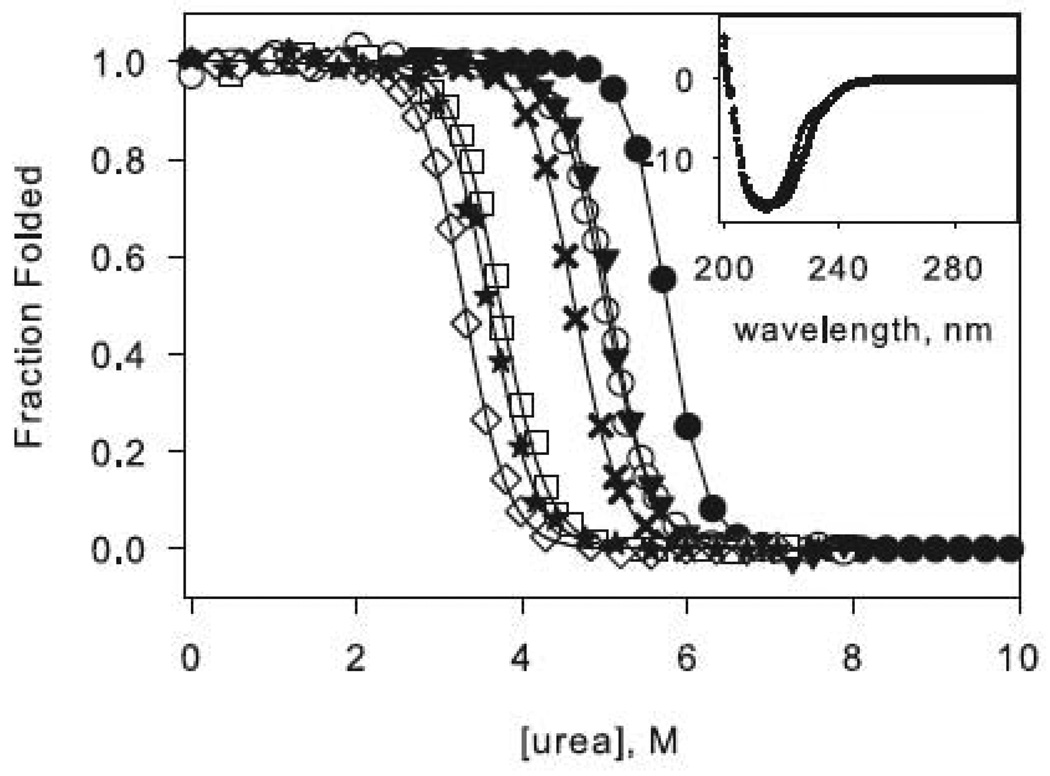
Proteins can sample a variety of partially folded conformations during the transition between the unfolded and native states. Some proteins never significantly populate these high-energy states and fold by an apparently two-state process. However, many proteins populate detectable, partially folded forms during the folding process. The role of such intermediates is a matter of considerable debate. A single amino acid change can convert Escherichia coli ribonuclease H from a three-state folder that populates a kinetic intermediate to one that folds in an apparent two-state fashion. We have compared the folding trajectories of the three-state RNase H and the two-state RNase H, proteins with the same native-state topology but altered regional stability, using a protein engineering approach. Our data suggest that both versions of RNase H fold through a similar trajectory with similar high-energy conformations. Mutations in the core and the periphery of the protein affect similar aspects of folding for both variants, suggesting a common trajectory with folding of the core region followed by the folding of the periphery. Our results suggest that formation of specific partially folded conformations may be a general feature of protein folding that can promote, rather than hinder, efficient folding.


Figures

Figure 1
Figure 1
Structure of E. coli RNase H with the “core” colored red and “periphery” in grey. (a) The core mutations are shown as sticks, with Ile 53 in yellow and Asp 105 and Trp 85 in blue. (b) The periphery mutations, Phe 8 and Ile 25, are shown in green.
Figure 1
Figure 1
Structure of E. coli RNase H with the “core” colored red and “periphery” in grey. (a) The core mutations are shown as sticks, with Ile 53 in yellow and Asp 105 and Trp 85 in blue. (b) The periphery mutations, Phe 8 and Ile 25, are shown in green.
Figure 2
Figure 2
Representative urea denaturation curves of variants of RNase H normalized to fraction folded. The two-state (a) and three-state (b) proteins are separated for clarity. Black lines represent the linear extrapolation fit assuming a two-state model. The data for the reference proteins RNH2 in panel (a) and RNH3 in panel (b) are shown as filled circles, and the mutations in each of these backgrounds are as follows: Q105G (open circles), W85A (closed triangles), F8A (filled crosses), I25A (open squares). In panel (b) F8A in the wild type background is shown as open diamonds, and W85A in the wild type background is shown as stars. CD spectra of the mutants are shown as insets in the same symbols.
Figure 2
Figure 2
Representative urea denaturation curves of variants of RNase H normalized to fraction folded. The two-state (a) and three-state (b) proteins are separated for clarity. Black lines represent the linear extrapolation fit assuming a two-state model. The data for the reference proteins RNH2 in panel (a) and RNH3 in panel (b) are shown as filled circles, and the mutations in each of these backgrounds are as follows: Q105G (open circles), W85A (closed triangles), F8A (filled crosses), I25A (open squares). In panel (b) F8A in the wild type background is shown as open diamonds, and W85A in the wild type background is shown as stars. CD spectra of the mutants are shown as insets in the same symbols.
Figure 3
Figure 3
Chevron plots for the three-state ((a) and (c)) and two-state ((b) and (d)) RNases H. The data for the reference proteins, RNH3 and RNH2, are filled circles. Panels (a) and (b) show the core mutation Q105G (filled triangles) and W85A (open squares). Panels (c) and (d) show the data for the periphery mutations F8A (open diamonds) and I25A (filled squares). The solid lines in (a) and (c) represent the fit to Scheme 1 and in (b) and (d) the fit to Scheme 2. The amplitudes are shown to the right of each chevron plot, with the initial signal shown as open symbols and final shown in closed symbols. The data are plotted as the fraction of relative overall signal. The black lines represent a linear extrapolation fit obtained by fixing the value for ΔG and m calculated from the chevron fit to show that they are consistent.
Figure 3
Figure 3
Chevron plots for the three-state ((a) and (c)) and two-state ((b) and (d)) RNases H. The data for the reference proteins, RNH3 and RNH2, are filled circles. Panels (a) and (b) show the core mutation Q105G (filled triangles) and W85A (open squares). Panels (c) and (d) show the data for the periphery mutations F8A (open diamonds) and I25A (filled squares). The solid lines in (a) and (c) represent the fit to Scheme 1 and in (b) and (d) the fit to Scheme 2. The amplitudes are shown to the right of each chevron plot, with the initial signal shown as open symbols and final shown in closed symbols. The data are plotted as the fraction of relative overall signal. The black lines represent a linear extrapolation fit obtained by fixing the value for ΔG and m calculated from the chevron fit to show that they are consistent.
Figure 4
Figure 4
Chevron plots for the core mutation W85A (a) and the periphery mutation F8A (b) in the wild type background. W85A RNH3 is shown as open triangles and W85A RNH2 as closed triangles. The dotted lines represent the wild type chevron while the dashed line represents a fit to the RNH2 chevron. F8A RNH3 is shown as open diamonds and F8A RNH2 as closed diamonds. The data for the two-state proteins are shown as in Figure 3 for comparison. The amplitudes are shown as in Figure 3.
Figure 4
Figure 4
Chevron plots for the core mutation W85A (a) and the periphery mutation F8A (b) in the wild type background. W85A RNH3 is shown as open triangles and W85A RNH2 as closed triangles. The dotted lines represent the wild type chevron while the dashed line represents a fit to the RNH2 chevron. F8A RNH3 is shown as open diamonds and F8A RNH2 as closed diamonds. The data for the two-state proteins are shown as in Figure 3 for comparison. The amplitudes are shown as in Figure 3.
Figure 5
Figure 5
A thermodynamic cycle addressing the interaction between Ile 53 and the mutated sites, represented here by Trp 85. The ΔΔG (kcal/mol) of unfolding upon making the indicated mutation is reported along the arrows. This cycle shows an interaction energy of 0.7 kcal/mol for residues 53 and 85.

Similar articles

Cited by

References

    1. Roder H, Maki K, Cheng H. Early events in protein folding explored by rapid mixing methods. Chem Rev. 2006;106:1836–1861. - PMC - PubMed
    1. Brockwell DJ, Radford SE. Intermediates: ubiquitous species on folding energy landscapes? Curr Opin Struct Biol. 2007;17:30–37. - PMC - PubMed
    1. Jahn TR, Radford SE. The Yin and Yang of protein folding. FEBS J. 2005;272:5962–5970. - PubMed
    1. Matouschek A, Kellis JT, Jr, Serrano L, Fersht AR. Mapping the transition state and pathway of protein folding by protein engineering. Nature. 1989;340:122–126. - PubMed
    1. Plaxco KW, Simons KT, Baker D. Contact order, transition state placement and the refolding rates of single domain proteins. J Mol Biol. 1998;277:985–994. - PubMed

Publication types

LinkOut - more resources