. 2009 Jun 23;106(25):10290-5.
doi: 10.1073/pnas.0904227106. Epub 2009 Jun 5.

Integrin beta1-focal adhesion kinase signaling directs the proliferation of metastatic cancer cells disseminated in the lungs

Affiliations

Integrin beta1-focal adhesion kinase signaling directs the proliferation of metastatic cancer cells disseminated in the lungs

Tsukasa Shibue et al. Proc Natl Acad Sci U S A. .

Erratum in

  • Proc Natl Acad Sci U S A. 2009 Aug 25;106(34):14734
  • Proc Natl Acad Sci U S A. 2014 Jan 7;111(1):563

Abstract

The development of metastases is an extended and inefficient process involving multiple steps. The last of these involves the growth of micrometastases into macroscopic tumors. We show here that intravenously injected, nonmetastatic cancer cells cease proliferating after extravasating into the parenchyma of the lungs; this response is attributable to the cells inability to trigger adhesion-related signaling events when they are scattered sparsely within the extracellular matrix (ECM) of the parenchyma. We recapitulate this situation by culturing these nonmetastatic cells at low seeding density in ECM-derived gels in vitro, in which they undergo cell-cycle arrest resulting, in part, from insufficient activation of focal adhesion kinase (FAK). Metastatic cancer cells, in contrast, show sufficient FAK activation to enable their proliferation within ECM gels in vitro and continue cell-cycle progression within the lung parenchyma in vivo. Activation of FAK in these metastatic cells depends on expression of the beta(1) subunit of integrins, and proliferation of these cells after extravasation in the lungs is diminished by knocking down the expression of either FAK or integrin beta(1). These results demonstrate the critical role of integrin beta(1)-FAK signaling axis in controlling the initial proliferation of micrometastatic cancer cells disseminated in the lungs.


Conflict of interest statement

The authors declare no conflict of interest.

Figures
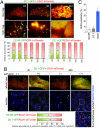
Fig. 1.
Fig. 1.
Behavior of D2 cells in an experimental model of lung metastasis. (A) Equal numbers of GFP-labeled D2.0R or D2.1 cells (D2.0R-GFP and D2.1-GFP, respectively) and tdTomato-labeled D2A1 cells (D2A1-tdTomato) were coinjected into the tail vein, and the lungs were harvested at the indicated time points. Shown are the representative high (high mag.) and low magnification (low mag.) images of the left upper lobe of the lungs harboring D2.1-GFP and D2A1-tdTomato cells (Top). [Scale bar, 1 mm (low mag.); 0.1 mm (high mag.).] The relative abundance of GFP- and tdTomato-labeled cells in the lungs was analyzed by flow cytometry (FACS) (Bottom Left: D2.0R-GFP and D2A1-tdTomato; Bottom Right: D2.1-GFP and D2A1-tdTomato). (B) Lungs were harvested at the indicated time points after the coinjection of D2.1-GFP and D2A1-tdTomato cells, and frozen sections were prepared. Shown are the representative whole lobe (Top row) and section images (Middle row). An enlarged image of the boxed region within the rightmost section image is also presented (Bottom Right). In some of the mice, the lung vasculature was perfused by injecting PBS and FluoSpheres with europium luminescence (Eu-FluoSpheres) in the right ventricle just before harvesting the lungs. In the section images, fluorescent signals from Eu-FluoSpheres represent the lumina of microvessels (white), and the nuclei were stained with Hoechst 33422 (blue). [Scale bar, 1 mm (whole lobe); 0.2 mm (section).] Frozen sections of the lungs after the coinjection of D2.0R-GFP and D2A1-tdTomato cells were also prepared. The relative abundance of perfusion-resistant D2.0R-GFP and D2A1-tdTomato cells, and that of D2.1-GFP and D2A1-tdTomato cells, in the lungs at 48 h after injection were determined by direct counting on the sections (Bottom). (C) At 7 days after the injection of tdTomato-labeled D2 cells, the lung vasculature was perfused and the lungs were harvested. BrdU was i.p. injected twice, at 6 and 3 h before harvesting the lungs. The percentage of BrdU-positive cells within the tdTomato-expressing population was analyzed by BrdU staining and FACS. Values are means ± SEM (n = 4) (A–C).
Fig. 2.
Fig. 2.
Two-dimensional and 3-dimensional culture of nonmetastatic and metastatic D2 cells. (A and B) D2 cells were seeded at an initial density of either 500 cells/cm2 bottom area (A) or 5,000 cells/cm2 bottom area (B) and propagated under 2D or 3D on-top conditions. Cell numbers were determined at the indicated time points (Top). Cells cultured under 3D on-top conditions for 5 days were also stained for proliferation marker (Ki67), and the positivity of Ki67 staining within each cell population is plotted (Bottom).
Fig. 3.
Fig. 3.
Cell-matrix adhesions of 2D- and 3D-cultured D2 cells. (A) D2 cells were propagated under 3D on-top culture conditions, and the typical morphologies of cells after 10 days of culture are presented. (Scale bar, 50 μm.) (B) D2 cells cultured under 2D or 3D conditions for 5 days were stained for paxillin (red), and the nuclei were stained with DAPI (blue). (Scale bar, 20 μm.) (C) To assess the levels of FAK phosphorylation, cell lysates were immunoprecipitated with anti-total FAK antibody, and the precipitates were analyzed by immunoblotting. Values are the band intensities relative to that of the corresponding band of the sample from 2D-cultured D2A1 cells.
Fig. 4.
Fig. 4.
The effects of manipulating FAK signaling on the in vitro and in vivo proliferation of D2 cells. (A) The effects of wild-type or mutant FRNK (FRNK WT and FRNK S1034, respectively) expression and FAK knockdown on the proliferation of D2A1 cells under 2D and 3D conditions of culture were analyzed. Proliferation of 3D-cultured D2A1 cells was impaired by expressing FRNK WT, but not by expressing FRNK S1034, in which dominant-negative effect is abrogated (Left). In the Right graphs, the effects of 2 different shRNA constructs targeting FAK expression (sh FAK B and C) and the effect of an shRNA control (sh scrambled) are presented (Table S1). Here, and in B, cell numbers were determined after 10 days of culture. (B) The effects of CD2-FAK expression on the proliferation of D2.0R and D2.1 cells under 2D and 3D conditions of culture were analyzed. (C) The effect of FAK knockdown on the BrdU incorporation by D2A1 cells after extravasation in the lungs in vivo was analyzed as in Fig. 1C. (D) Lungs were harvested at 24 days after the tail-vein injection of GFP-labeled D2A1 cells expressing an shRNA control (sh scrambled) or GFP-labeled FAK knockdown D2A1 cells (sh FAK B or C). Shown are the representative images of the left upper lobe of the lungs (Top). (Scale bar, 1 mm.) The numbers of macroscopic metastases observed on the surface of the left upper lobe are plotted (Bottom). The red bar indicates the mean value in each sample group. Values are means ± SD (n = 3) (A and B) or means ± SEM (n = 4) (C).
Fig. 5.
Fig. 5.
Recruitment and activation of FAK by β1-containing integrins in 3D-cultured D2A1 cells. (A) The effects of integrin subunit knockdown on the proliferation of D2A1 cells under 2D and 3D conditions of culture were analyzed. Cells were cultured for 10 days. The capital letter at the end of each shRNA label is added for distinguishing different shRNA constructs for the same target, and multiple different constructs were tested for targeting each of integrin α3, α5, α6, αv, and β1 expression, whereas a single shRNA construct was tested for targeting the expression of integrin β3 (sh integrin β3 C) (Table S1 and Table S2). Cell numbers relative to that of D2A1 cells expressing an shRNA control (sh scrambled) are plotted. Values are means ± SD (n = 3). (B) Colocalization between FAK (red) and integrin β1, integrin α5, or integrin αv (green) in D2A1 cells under 2D or 3D culture conditions (Matrigel, on-top) was analyzed by immunofluorescence. Cell nuclei were stained with YOYO-1 (blue). (Scale bar, 20 μm.) (C) The effects of integrin β1 knockdown on the levels of FAK phosphorylation at Y397 and Y861 in 3D-cultured D2A1 cells were analyzed as in Fig. 3C. Two different shRNA constructs targeting the expression of integrin β1 were tested (sh integrin β1 A and C). Values are the band intensities relative to that of the corresponding bands of the sample from D2A1 cells expressing an shRNA control (sh scrambled). (D) The effect of integrin β1 knockdown on the BrdU incorporation by D2A1 cells after extravasation in the lungs in vivo was analyzed as in Fig. 1C. Values are means ± SEM (n = 4).

Similar articles

Cited by

References

    1. Fidler IJ. The pathogenesis of cancer metastasis: The ‘seed and soil’ hypothesis revisited. Nat Rev Cancer. 2003;3:453–458. - PubMed
    1. Braun S, et al. A pooled analysis of bone marrow micrometastasis in breast cancer. N Engl J Med. 2005;353:793–802. - PubMed
    1. Aguirre-Ghiso JA. Models, mechanisms and clinical evidence for cancer dormancy. Nat Rev Cancer. 2007;7:834–846. - PMC - PubMed
    1. Mareel MM, De Baetselier P, Roy MV. Mechanism of Invasion and Metastasis. 1st Ed. Boca Raton: CRC press; 1991. p. 584.
    1. Mehlen P, Puisieux A. Metastasis: A question of life or death. Nat Rev Cancer. 2006;6:449–458. - PubMed

Publication types