

Pyrosequencing-based assessment of soil pH as a predictor of soil bacterial community structure at the continental scale
- PMID: 19502440
- PMCID: PMC2725504
- DOI: 10.1128/AEM.00335-09
Pyrosequencing-based assessment of soil pH as a predictor of soil bacterial community structure at the continental scale
Abstract
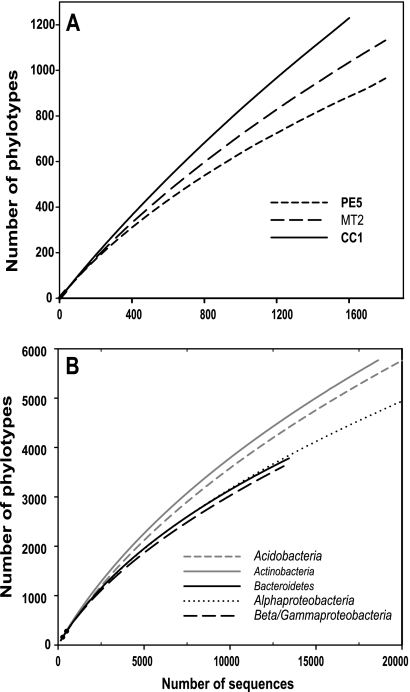
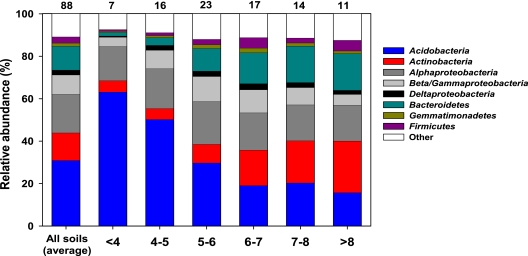
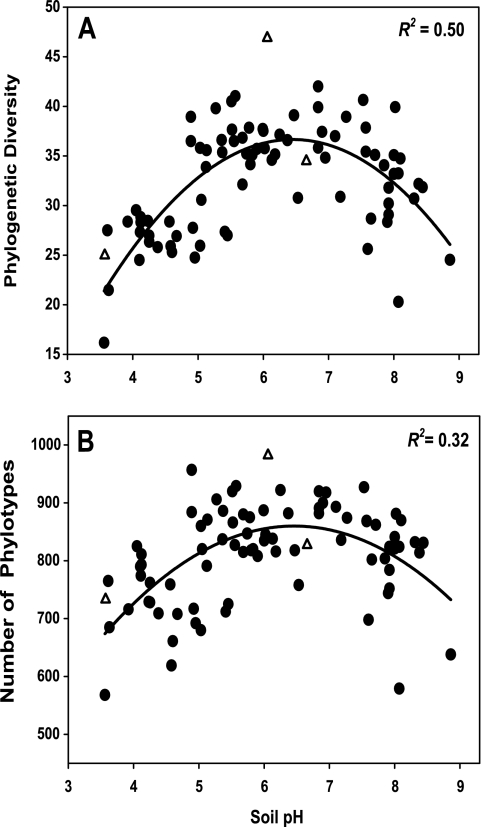
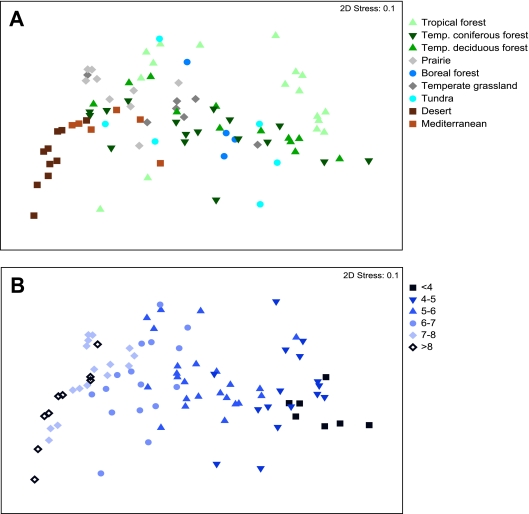
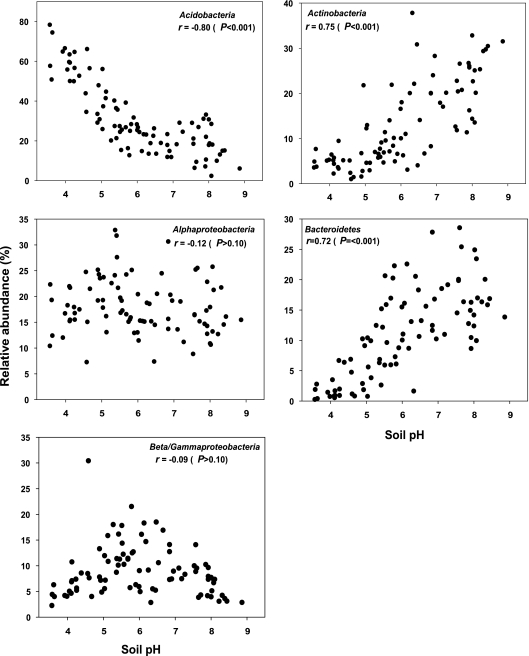
Soils harbor enormously diverse bacterial populations, and soil bacterial communities can vary greatly in composition across space. However, our understanding of the specific changes in soil bacterial community structure that occur across larger spatial scales is limited because most previous work has focused on either surveying a relatively small number of soils in detail or analyzing a larger number of soils with techniques that provide little detail about the phylogenetic structure of the bacterial communities. Here we used a bar-coded pyrosequencing technique to characterize bacterial communities in 88 soils from across North and South America, obtaining an average of 1,501 sequences per soil. We found that overall bacterial community composition, as measured by pairwise UniFrac distances, was significantly correlated with differences in soil pH (r = 0.79), largely driven by changes in the relative abundances of Acidobacteria, Actinobacteria, and Bacteroidetes across the range of soil pHs. In addition, soil pH explains a significant portion of the variability associated with observed changes in the phylogenetic structure within each dominant lineage. The overall phylogenetic diversity of the bacterial communities was also correlated with soil pH (R(2) = 0.50), with peak diversity in soils with near-neutral pHs. Together, these results suggest that the structure of soil bacterial communities is predictable, to some degree, across larger spatial scales, and the effect of soil pH on bacterial community composition is evident at even relatively coarse levels of taxonomic resolution.
Figures
References
-
- Acosta-Martínez, V., S. Dowd, Y. Sun, and V. Allen. 2008. Tag-encoded pyrosequencing analysis of bacterial diversity in a single soil type as affected by management and land use. Soil Biol. Biochem. 40:2762-2770.
-
- Bääth, E., and T. H. Anderson. 2003. Comparison of soil fungal/bacterial ratios in a pH gradient using physiological and PLFA-based techniques. Soil Biol. Biochem. 35:955-963.
-
- Blagodatskaya, E. V., and T. H. Anderson. 1998. Interactive effects of pH and substrate quality on the fungal-to-bacterial ratio and qCO2 of microbial communities in forest soils. Soil Biol. Biochem. 30:1269-1274.
Publication types
MeSH terms
Substances
Grants and funding
LinkOut - more resources
Full Text Sources
Other Literature Sources
Molecular Biology Databases
