. 2010 Feb;20(2):411-24.
doi: 10.1093/cercor/bhp112. Epub 2009 Jun 5.

Human v6: the medial motion area

Affiliations

Human v6: the medial motion area

S Pitzalis et al. Cereb Cortex. 2010 Feb.

Abstract

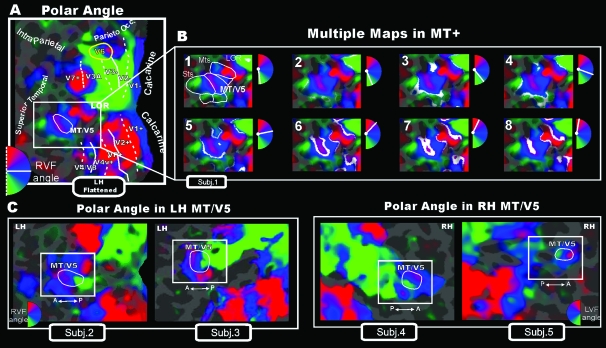
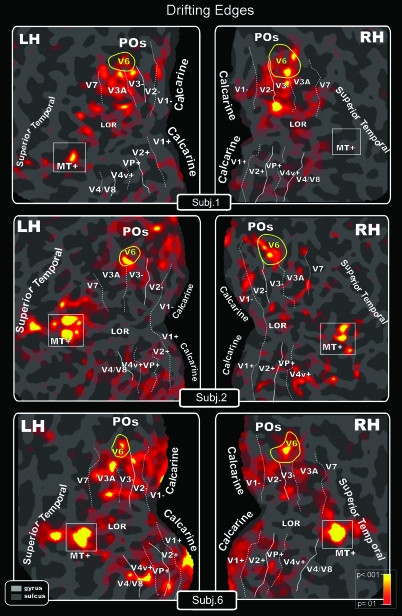
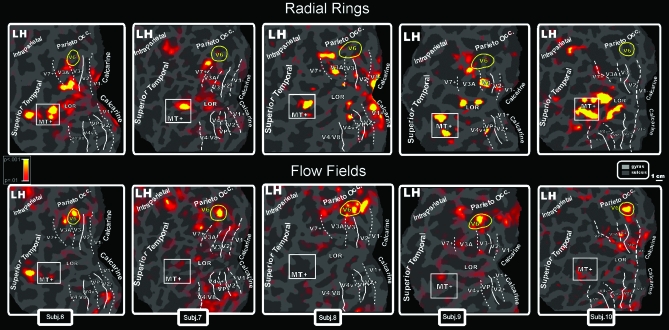
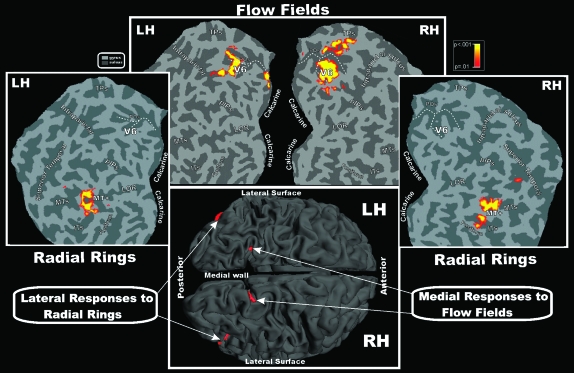
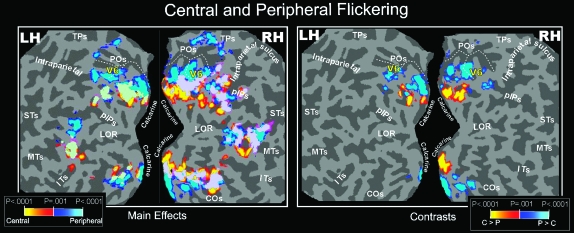
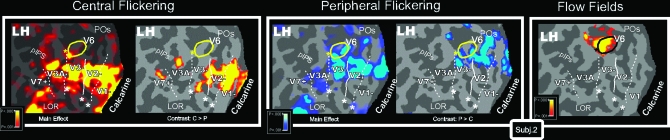
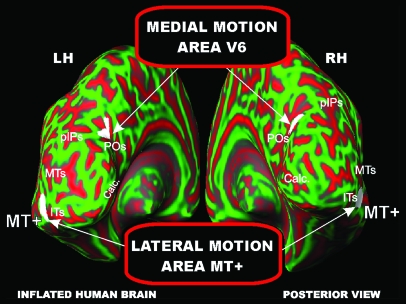
Cortical-surface-based functional Magnetic Resonance Imaging mapping techniques and wide-field retinotopic stimulation were used to verify the presence of pattern motion sensitivity in human area V6. Area V6 is highly selective for coherently moving fields of dots, both at individual and group levels and even with a visual stimulus of standard size. This stimulus is a functional localizer for V6. The wide retinotopic stimuli used here also revealed a retinotopic map in the middle temporal cortex (area MT/V5) surrounded by several polar-angle maps that resemble the mosaic of small areas found around macaque MT/V5. Our results suggest that the MT complex (MT+) may be specialized for the analysis of motion signals, whereas area V6 may be more involved in distinguishing object and self-motion.


Figures

Figure 1.
Figure 1.
Visual motion sensitivity in monkey area V6. (A) V6 neuron better activated by the motion of a Luminance Border (left) than by a bar of the same orientation and direction of motion (right). Each inset contains, from top to bottom: schematic representation of the receptive field (dashed line) and of the stimulus moved across it in the direction indicated by the arrow, peri-event time histogram, bar indicating the duration of visual stimulation, raster plots of spikes recorded during each trial, recordings of horizontal and vertical components of eye positions. Bin width = 20 ms; Eye traces: scale bar, 60 deg. (B) “Left”: direction selective V6 neuron. All conventions as in (A). “Right”: Incidence of direction sensitivity in V6 neuronal population. Insensitive: cells whose responses to the stimulus moving in the direction opposite to the preferred one were >80% of the discharge evoked when the stimulus moved in the preferred direction. Sensitive: cells whose responses in the opposite direction were between 20% and 80% of those in the preferred direction. Selective: cells whose responses in the opposite direction were <20% of that in the preferred one.
Figure 2.
Figure 2.
Stimuli used for visual stimulation. (A) Drifting Edges. For the ON phase, the edge is shown in the central position of the screen and indicates the 8 possible directions of stimulus motion: vertically (top > down; bottom > up), horizontally (left > right; right > left), and in 2 oblique directions (45 > 225-deg corner and vice versa; 315 > 135-deg corner and vice versa). The directions switched every 2-5 s. The frames of the OFF phase show 4 of 32 possible static frames (16 light/dark and 16 dark/light) located in 4 of 16 spatial positions of the stimulus. (B) Radial Rings. The 2 frames of the ON phase show the 2 directions of the radial motion (outward and inward) that switched every 2 s and that were compared with stationary rings presented during the OFF phase. (C) Flow Fields. The 2 frames of the ON phase show the 2 different types of coherent motion (radial and rotation–spiral motion) that switched almost every 500 ms and were compared with random motion presented during the OFF phase. For both radial and spiral motions, we tested both expansion and contraction components. (D) Flickering. During the ON phase, the high-contrast circles flickering at 5 Hz (100% luminance contrast) were presented either in central (20-deg outer radius; left column) or peripheral (25-deg inner radius; 45-deg outer radius; right column) position. Central and peripheral versions of the luminance flicker were tested in separate sessions. The OFF phase was constituted by a uniform gray field. For all stimuli, we used a wide-field stimulation (up to 110 deg) and the subjects were instructed to fixate the central red cross to minimize eye movements. See Materials and Methods for further details.
Figure 3.
Figure 3.
Wide-field retinotopy of polar-angle representation. Color hue indicates the response phase, which is proportional to the polar angle of the local visual field representation: Green/blue/red areas represent lower/horizontal/upper fields, respectively (see hemifield icons). (A) Flattened reconstruction of the left hemisphere of one participant (as reported in Pitzalis et al. 2006) showing retinotopic phase–encoded signal in the dorsal and ventral cortical areas (including medial V6 and lateral MT/V5). Here and in the following figures reporting individual data, the flat map also shows the boundaries of the early visual areas and of area V6 defined by mapping visual field sign (Sereno et al. 1994, 1995). Dotted and solid white lines reported on the flat maps indicate vertical and horizontal meridians, respectively, and yellow outlines indicate location and borders of the human area V6. Major sulci (dark gray) are labeled as follows: Parieto-occ, parieto-occipital sulcus; Intraparietal sulcus, STs, Superior Temporal sulcus; MTs, Middle Temporal sulcus. LOR, Lateral Occipital Region. (B) Detailed organization of the polar-angle representation shown using close-up views of the flattened left lateral middle temporal (white box) regions of the same subject. In each frame, response-phase contours are marked with white stripes representing the cortical regions activated by a single polar angle and indicated in white in the small hemifield icons located at the upper right of each snapshot. The complete range of phases in one hemifield (180 deg) is illustrated across the 8 close-ups of the flattened surface. (C) Retinotopy of polar-angle representation in MT/V5 area (white outline) shown in other 2 left (left part) and 2 right (right part) hemispheres using close-up views of the flattened lateral middle temporal (white box) regions.
Figure 4.
Figure 4.
Drifting Edges (both V6 and MT+ response). Topography of motion-selective activity by fMRI mapping from unidirectional motion stimuli displayed on flat maps from left and right hemispheres of 3 participants. Figure shows the differentiated blood oxygen level–dependent (BOLD) activity between conditions: red–yellow regions indicate in a pseudocolor scale higher BOLD activity (P < 0.001) during moving than during stationary luminance edges. Main sulci have text labels. POs, Parieto-Occipital sulcus. Other labels and logos are as in Figure 3.
Figure 5.
Figure 5.
Topography of motion-selective activity by fMRI mapping from Radial Rings (Top: MT+ but not V6 response) and Flow Fields (Bottom: V6 but not MT+ response) stimulations. Results are displayed on flat maps from the left hemispheres of 5 participants. Figure shows the differentiated BOLD activity between ON and OFF conditions. Top row: Red–yellow regions indicate in a pseudocolor scale higher BOLD activity (P < 0.001) during radially moving rings than during stationary patterns. Bottom rows: Red–yellow regions indicate higher activity (P < 0.001) during rotating and dilating random dot fields than during scrambled moving random dot fields. Main sulci have text label. Other labels and logos are as in Figure 3.
Figure 6.
Figure 6.
Group contralateral fMRI activations for the Flow Fields and Radial Rings stimuli superimposed on left and right occipital flat maps of the SPM canonical brain in MNI space. The pseudocolor scale in the top right of the figure indicates the statistical significance of the activations. The fundus (dashed lines) of POS is also drawn in both hemispheres to aid comparisons. Major sulci (dark gray) and gyri are labeled as follows: TPs, transverse segment of the parietal sulcus; pIPs, posterior segment of the IPS; MTs, middle temporal sulcus; ITs, inferior temporal sulcus; fusiform, Fusiform gyrus. Bottom: group fMRI activations for the same visual stimuli superimposed on the left and right folded hemispheres (dorsal view) of the SPM canonical brain in MNI space. Other labels and logos are as in Figures 3 and 4.
Figure 7.
Figure 7.
Central and Peripheral Flickering (Group Data). Group fMRI activations from Flickering stimulus, displayed on occipital flat maps of the left and right hemispheres of the SPM canonical brain. Left and right sections of the figure show results from the direct (main effects) and differential (contrasts) approach, respectively. Functional activations from stimuli presented separately in central (0–20 deg) and peripheral (25–45 deg) parts of the visual field are color coded (red and blue, respectively) and are shown together in each flat map (light green, overlap). The fundus (dashed lines) of POS is also drawn in both hemispheres to aid comparisons. The pseudocolor scale in the bottom of both figures indicates the statistical significance of the activations. STs, Superior Temporal sulcus; COs, Collateral Sulcus. Other labels and logos are as in Figures 3, 4, and 6.
Figure 8.
Figure 8.
Flickering and Flow Fields (Individual Data). Individual results of one single subject displayed on flat maps from close-ups of the left hemisphere (only the dorsal visual areas are shown). The position and borders of area V6 (as retinotopically defined in this subject) are indicated with a continuous yellow outline, except for the rightmost map where the V6 outline is in black to avoid color masking with the yellow colored fMRI activation spots. The asterisk indicates the representation of the center of gaze as retinotopically mapped. Left and middle sections: fMRI activations for Flickering stimulus from direct (main effects) and differential (contrasts) approach, respectively. Functional activations from stimuli presented separately in central (0–20 deg) and peripheral (25–45 deg) parts of the visual field are color coded (red and blue, respectively) and are shown separately in each flat map. Right section: individual fMRI mapping from Flow Fields stimulus from the same subject as in left and middle sections. Other labels and logos are as in Figures 3, 4, and 6.
Figure 9.
Figure 9.
Brain location of the two motion areas V6 and MT+. Group fMRI activations for the Flow Fields and Radial Rings stimuli superimposed on the left and right inflated hemispheres (posterior view) of the SPM canonical brain in MNI space. Calc, Calcarine. Other labels and logos are as in Figures 4 and 6.

References

    1. Albright TD. Direction and orientation selectivity of neurons in visual area MT of the macaque. J Neurophysiol. 1984;52(6):1106–1130. - PubMed
    1. Allman JM, Kaas J. A representation of the visual field in the caudal third of the middle temporal gyrus of the owl monkey (Aotus trivirgatus) Brain Res. 1971;31:85–105. - PubMed
    1. Allman JM, Kaas J. Representation of the visual field on the medial wall of the occipital–parietal cortex in the owl monkey. Science. 1976;191:572–575. - PubMed
    1. Beer J, Blakemore C, Previc FH, Liotti M. Areas of the human brain activated by ambient visual motion, indicating three kinds of self-movement. Exp Brain Res. 2002;143(1):78–88. - PubMed
    1. Blanke O, Landis T, Mermoud C, Spinelli L, Safran AB. Direction-selective motion blindness after unilateral posterior brain damage. Eur J Neurosci. 2003;18(3):709–722. - PubMed

Publication types

MeSH terms