. 2009 Aug;37(14):4657-71.
doi: 10.1093/nar/gkp469. Epub 2009 Jun 5.

Activation of alternative Jdp2 promoters and functional protein isoforms in T-cell lymphomas by retroviral insertion mutagenesis

Affiliations

Activation of alternative Jdp2 promoters and functional protein isoforms in T-cell lymphomas by retroviral insertion mutagenesis

Mads Heilskov Rasmussen et al. Nucleic Acids Res. 2009 Aug.

Abstract

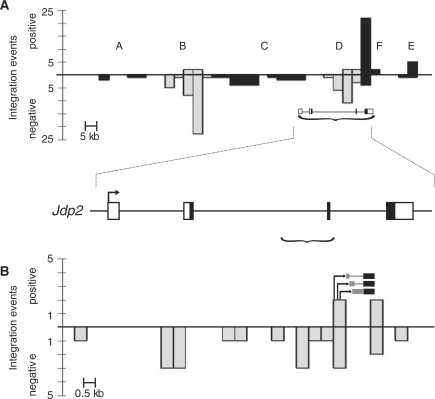
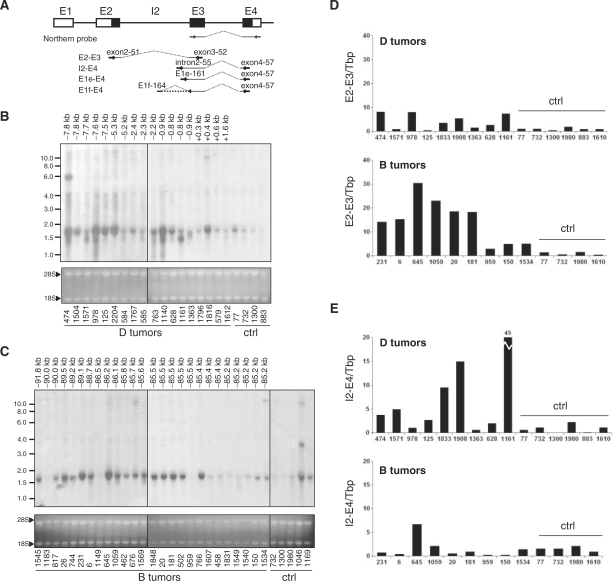
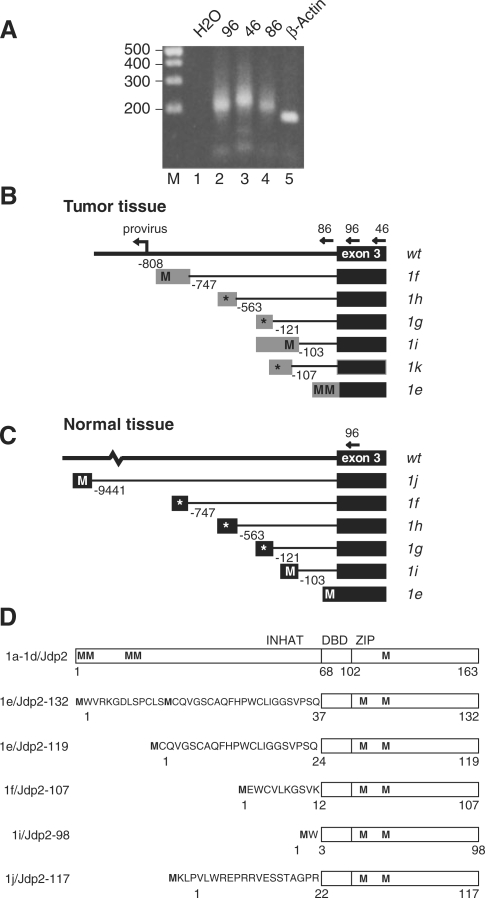
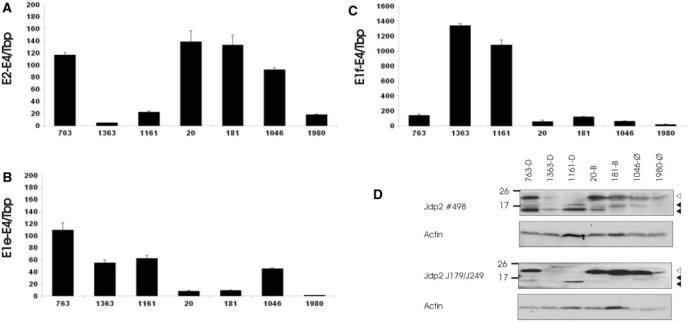
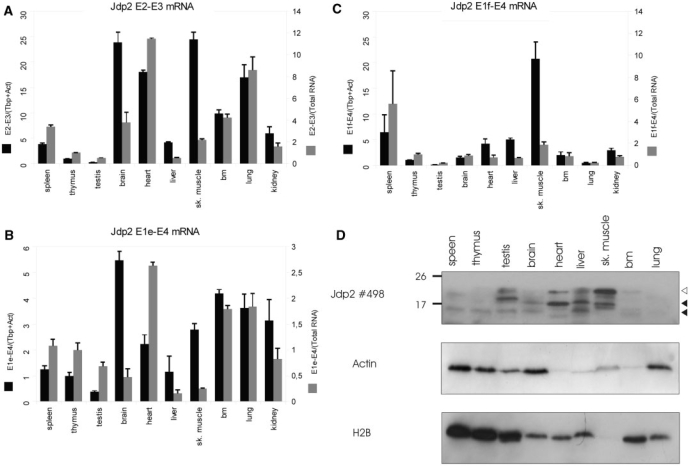
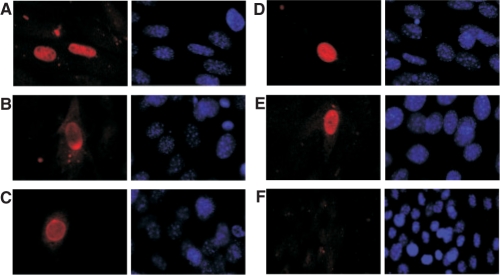
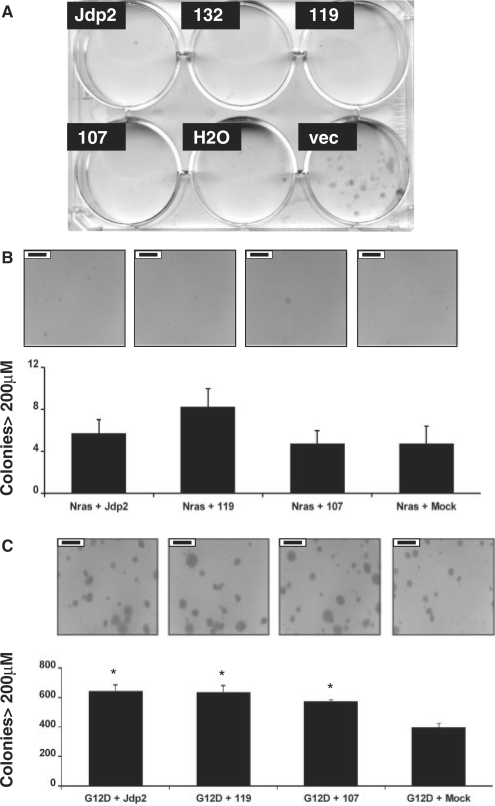
Retroviral insertional mutagenesis has been instrumental for the identification of genes important in cancer development. The molecular mechanisms involved in retroviral-mediated activation of proto-oncogenes influence the distribution of insertions within specific regions during tumorigenesis and hence may point to novel gene structures. From a retroviral tagging screen on tumors of 1767 SL3-3 MLV-infected BALB/c mice, intron 2 of the AP-1 repressor Jdp2 locus was found frequently targeted by proviruses resulting in upregulation of non-canonical RNA subspecies. We identified several promoter regions within 1000 bp upstream of exon 3 that allowed for the production of Jdp2 protein isoforms lacking the histone acetylase inhibitory domain INHAT present in canonical Jdp2. The novel Jdp2 isoforms localized to the nucleus and over-expression in murine fibroblast cells induced cell death similar to canonic Jdp2. When expressed in the context of oncogenic NRAS both full length Jdp2 and the shorter isoforms increased anchorage-independent growth. Our results demonstrate a biological function of Jdp2 lacking the INHAT domain and suggest a post-genomic application for the use of retroviral tagging data in identifying new gene products with a potential role in tumorigenesis.


Figures

Figure 1.
Figure 1.
The Jdp2 locus. (A) The number of integration events around Jdp2 as identified by retroviral tagging are shown in 5000 bp bins from positions 86 370 000 to 86 555 000 on chromosome 12 (UCSC mm8 February 2006) (top). The bars below and above the horizontal axis represent negative and positive, respectively, transcriptional orientation of the proviruses relative to that of the Jdp2 gene. Proviral integration clusters A through F are shown with clusters B and D highlighted in gray. A structure of the Jdp2 gene based on RefSeq NM_030887 is depicted at its chromosomal location (marked with a bracket) with the coding sequence indicated by black coloring (bottom). (B) Close-up on integration cluster D [genome coordinates 86 509 000–86 523 000, marked with a bracket in (A)] in the 3′ end of intron 2 and exon 3 with provirus position and transcriptional orientation depicted as in (A) using 500 bp bins. Schematic examples of provirus-host chimeric transcripts identified are shown with black and gray boxes indicating Jdp2 exon 3 and intron 2 sequences, respectively.
Figure 2.
Figure 2.
Correlation of intragenic provirus insertion and appearance of Jdp2 intron 2 including transcripts. (A) Schematic representation of the localization of the Northern blot probe and QRT-PCR amplicons E2-E3, E2-E4, I2-E4, E1e-E4 and E1f-E4 for Jdp2 mRNA detection with exons shown as boxes and coding sequence in black. (B and C) Northern blotting on total RNA from thymus tumors from a subset of animals with integration in clusters D (B) and B (C) according to the retroviral tagging data. Control samples (Ctrl) are thymic tumors from retrovirus-infected animals of the same cohort in which no integrations were found by retroviral tagging. The distance between integration and the beginning of Jdp2 exon 3 for each tumor is shown above the lanes. Ethidium bromide staining of ribosomal bands 28S and 18S was used to evaluate even loading and RNA integrity. (D and E) QRT-PCR on a subset of D tumors and B tumors amplifying either Refseq Jdp2 mRNA (E2-E3) (D) or intron 2-including alternative mRNA (I2-E4) (E). The signal was normalized to Tbp and shown as fold difference to the average of control tumor samples (Ctrl).
Figure 3.
Figure 3.
Identification of Jdp2 intron 2 mRNAs. (A) Ethidium bromide-stained agarose gel showing representative PCR products with linker-specific forward primer on 5′ RACE cDNA from tumor 1161 using different reverse primers in Jdp2 (oligos 96, 46 and 86, lanes 2, 3 and 4, respectively) and Actb exon 3 (lane 5); in lane 1 no cDNA template was added. (B) and (C) Schematic structure of the alternative Jdp2 exon 1e through 1k as found by 5′ RACE in tumor tissue (B) and normal tissue (C). Positions of exon 1-specific splice donor sites relative to exon 3 are given in base pairs. Putative start codons (M) in frame with the ORF of Jdp2 are indicated, while an asterisk indicates that no ORF is present in frame with Jdp2. (D) Protein structure of Jdp2 as generated from exon 1a through 1d, and predicted Jdp2 isoforms generated from exon 1e, 1f, 1i and 1j. The INHAT domain as well as the basic DNA binding domain (DBD) and the leucine zipper (ZIP) regions are indicated. Methionines are indicated (M) and the N-terminal peptides are shown for the isoforms.
Figure 4.
Figure 4.
Jdp2 isoforms are highly expressed in T-cell tumors. (A–C) QRT-PCR was done in triplicates on tumor tissues to detect full length (A), exon 1e-3-4 (B) and exon 1f-3-4 (C) mRNA. Expression signal was normalize with Tbp and shown as fold difference to uninfected control thymus. The figures are representative of two to three experiments. (D) Two separate western blot experiments using 0.2 μM PVDF membranes were done on crude protein extracts from the same tumors as in (A–C) using either polyclonal anti-Jdp2 antibody (#489) (top) or a mix of monoclonal anti-Jdp2 antibodies J176 and J249 (bottom). Membranes were subsequently immunoblotted using anti-β-Actin antibody. Open and closed arrows indicate position of full length (∼20 kDa) and isoform Jdp2 (∼14 and 17 kDa), respectively.
Figure 5.
Figure 5.
Jdp2 isoforms are differentially expressed in the normal tissue. (AC) QRT-PCR was done in triplicates as described for Figure 5 on the indicated BALB/c mouse tissues to detect full length (A), exon 1e-3-4 (B) and exon 1f-3-4 (C) mRNA. Expression signal is shown as normalized to the geometric mean of Actb and Tbp (black bars) or normalized to total RNA (white bars) and is shown as fold difference to thymus. The figures are representative of two–three experiments. (D) Western blotting on 0.2 μM PVDF membranes using polyclonal anti-Jdp2 and, subsequently, anti-β-Actin and anti-H2B antibody on crude protein extracts from the same panel of BALB/c tissue. Open and closed arrows indicate the position of full length and isoform Jdp2.
Figure 6.
Figure 6.
Jdp2 isoforms localize to the nucleus. NIH3T3 cells were transiently transfected with vectors expressing N-terminally FLAG tagged full length Jdp2 (A) or either of three N-terminally Jdp2 isoforms, Jdp2-132 (B-C), Jdp2-119 (D) or Jdp2-107 (E). As controls are shown cells transfected with empty vector (F). The subcellular localization was revealed by immunocyotchemistry using an anti-FLAG primary antibody (left). Cells were co-stained with DAPI dye (right). The results are representative of three independent experiments.
Figure 7.
Figure 7.
Phenotypic effects of ectopic expression of Jdp2 isoforms. (A) NIH3T3 cells were transiently transfected with vectors expressing N-terminally FLAG tagged full length Jdp2 or either of three N-terminally Jdp2 isoforms, Jdp2-132, Jdp2-119 or Jdp2-107. Twenty-four hours after transfection, cells started growing in a selective medium containing puromycin. Three weeks later, the cells were fixed in methanol and colonies stained with methylene blue. The results are representative of two independent experiments, each done in duplicate. (B and C) NIH 3T3 cells were co-transduced with the indicated vectors (m.o.i. = 1) 48 h before being seeded in the medium supplemented with 0.5% agar. After 2 weeks of growth, 100 pictures per dish were taken, and the number of colonies larger than 200 μm were counted. Error bars indicate the standard error of the mean from four independent experiments of which representative pictures are shown. The black scale bar—insert in each pictures—corresponds to 500 μm. A significant difference (P ≤ 0.05) to ‘G12D + Vector’ by two-tailed Student's t-test is shown with an asterisk.

References

    1. Aronheim A, Zandi E, Hennemann H, Elledge SJ, Karin M. Isolation of an AP-1 repressor by a novel method for detecting protein–protein interactions. Mol. Cell Biol. 1997;17:3094–3102. - PMC - PubMed
    1. Jin C, Ugai H, Song J, Murata T, Nili F, Sun K, Horikoshi M, Yokoyama KK. Identification of mouse Jun dimerization protein 2 as a novel repressor of ATF-2. FEBS Lett. 2001;489:34–41. - PubMed
    1. Broder YC, Katz S, Aronheim A. The ras recruitment system, a novel approach to the study of protein–protein interactions. Curr. Biol. 1998;8:1121–1124. - PubMed
    1. Cherasse Y, Chaveroux C, Jousse C, Maurin AC, Carraro V, Parry L, Fafournoux P, Bruhat A. Role of the repressor JDP2 in the amino acid-regulated transcription of CHOP. FEBS Lett. 2008;582:1537–1541. - PubMed
    1. Weidenfeld-Baranboim K, Bitton-Worms K, Aronheim A. TRE-dependent transcription activation by JDP2-CHOP10 association. Nucleic Acids Res. 2008;36:3608–3619. - PMC - PubMed

Publication types

MeSH terms