

doi: 10.1093/biostatistics/kxp016.
Epub 2009 Jun 5.
A novel approach to cancer staging: application to esophageal cancer
Affiliations
- PMID: 19502615
- PMCID: PMC3590074
- DOI: 10.1093/biostatistics/kxp016
Item in Clipboard
A novel approach to cancer staging: application to esophageal cancer
Biostatistics.
2009 Oct.
Abstract
A novel 3-step random forests methodology involving survival data (survival forests), ordinal data (multiclass forests), and continuous data (regression forests) is introduced for cancer staging. The methodology is illustrated for esophageal cancer using worldwide esophageal cancer collaboration data involving 4627 patients.
Figures
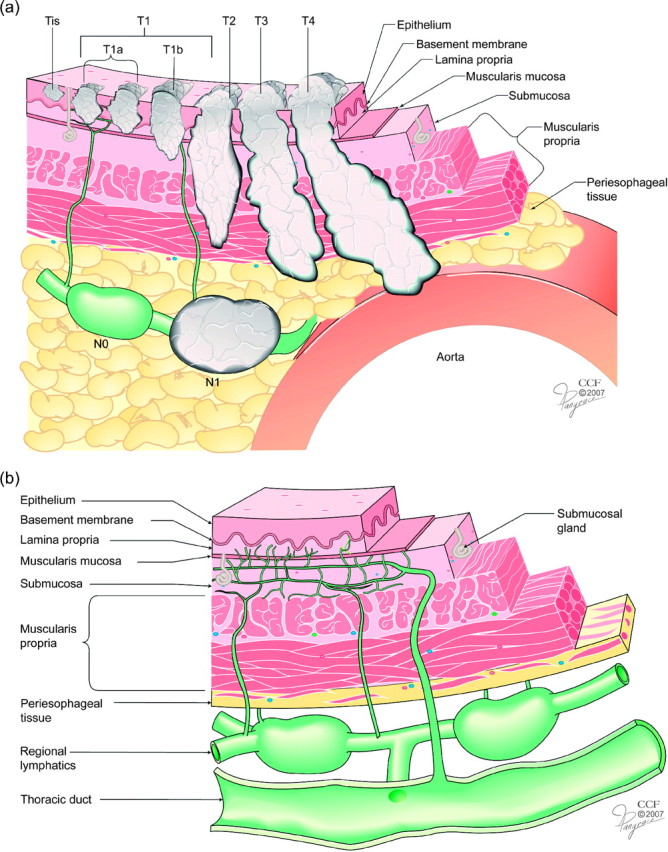
(a) Current anatomic cancer classification for esophageal cancer. Anatomic cancer classification is by depth of cancer invasion (T) and regional lymph node classification (N), defined by absence (N0) or presence (N1) of cancer-positive lymph nodes. Distant metastasis (M) not illustrated. (b) Unique lymphatic drainage of esophagus is both intramural and longitudinal, which couples T and N. There are direct connections from superficial lymphatics to regional lymphatics without a barrier effect of the muscularis propria and treacherous bypass channels directly connecting the submucosal lymphatic plexus and thoracic duct.

Thin gray lines are RSF OOB ensemble survival curves stratified by OOB ensemble mortality (stratification in equal percentile increments of 4%). Superimposed thick black curves represent one possible template grouping for developing a stage grouping.
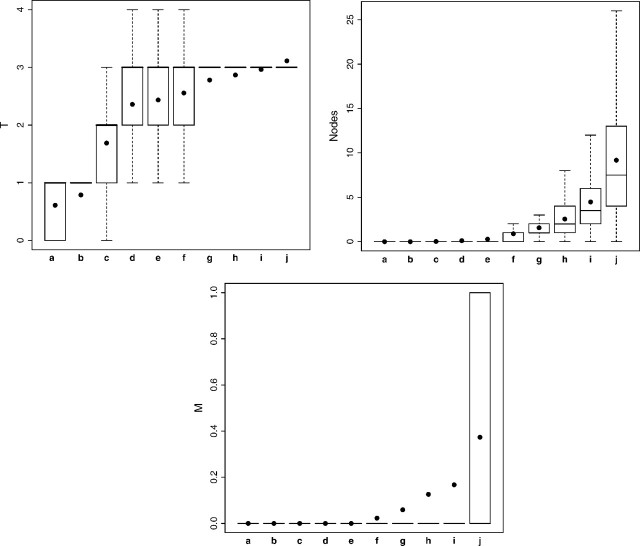
Box plots for variables T, Nodes, and M used in an RSF analysis stratified by template grouping of Figure 2. Box includes 25th and 75th percentiles; horizontal line within box is median; dots within box are means.
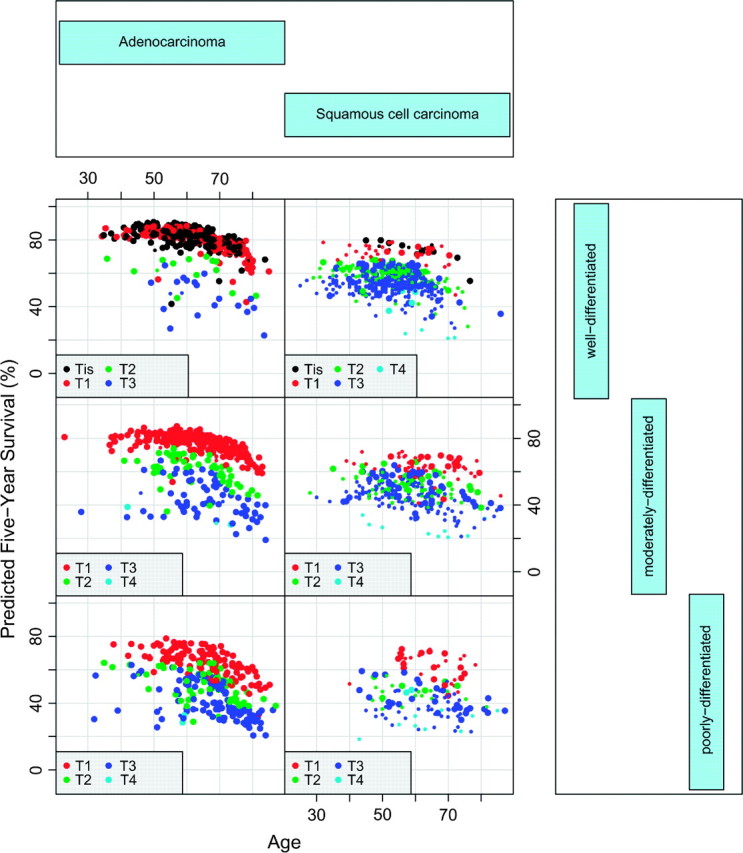
Coplot of 5-year predicted survival against age, conditioned by histopathologic cell type and G (upper, middle, and lower rows are G1, G2, and G3–4, respectively). Data restricted to N0M0 cancers. Large colored points indicate tumors whose primary cancer location is the lower thoracic esophagus.
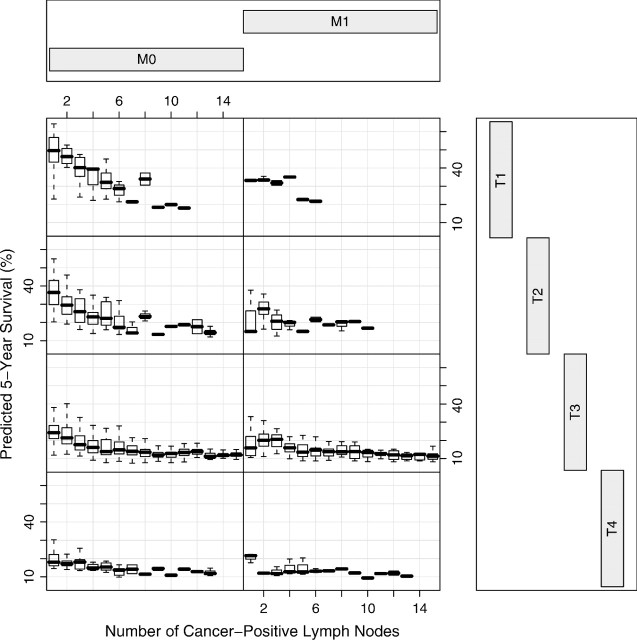
Box plots of 5-year predicted survival against number of cancer-positive lymph nodes, conditioned by T and M for adenocarcinoma esophageal data. Number of positive lymph nodes is truncated at 15 to improve visualization.
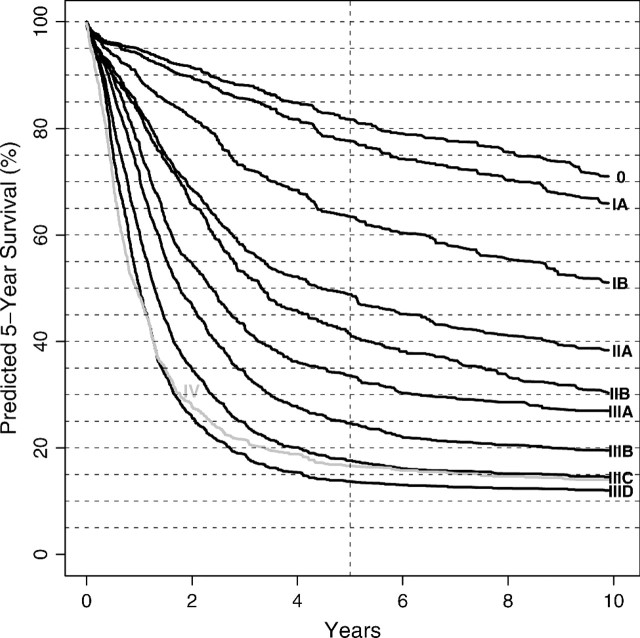
RSF ensemble survival curves for adenocarcinoma esophageal data-driven stage groupings.
References
-
- American Joint Committee on Cancer. AJCC Cancer Staging Manual. 6th edition. New York: Springer; 2002.
-
- American Joint Committee on Cancer. AJCC Cancer Staging Manual. (7th edition) 2009 in press.
-
- Balch CM, Buzaid AC, Soong SJ, Atkins MB, Cascinelli N, Coit DG, Fleming ID, Gershenwald JE, Houghton A, Jr, Kirkwood JM, and others Final version of the American Joint Committee on Cancer staging system for cutaneous melanoma. Journal of Clinical Oncology. 2001;19:3635–3648. - PubMed
-
- Breiman L. Heuristics of instability and stabilization in model selection. Annals of Statistics. 1996;24:2350–2383.
-
- Breiman L. Random forests. Machine Learning. 2001;45:5–32.
Publication types
MeSH terms
LinkOut - more resources
Full Text Sources
Other Literature Sources
Medical
