. 2009 Nov;50(11):2212-21.
doi: 10.1194/jlr.M900013-JLR200. Epub 2009 Jun 6.

Mice lacking Pctp /StarD2 exhibit increased adaptive thermogenesis and enlarged mitochondria in brown adipose tissue

Affiliations

Mice lacking Pctp /StarD2 exhibit increased adaptive thermogenesis and enlarged mitochondria in brown adipose tissue

Hye Won Kang et al. J Lipid Res. 2009 Nov.

Abstract

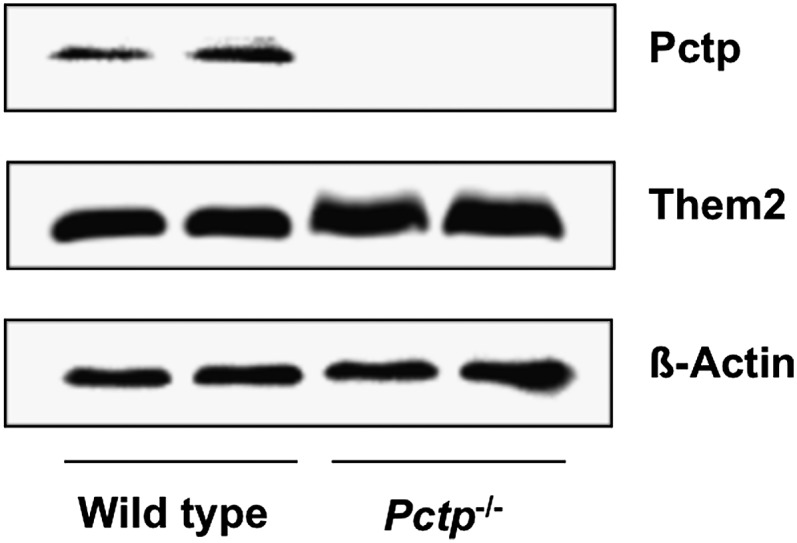
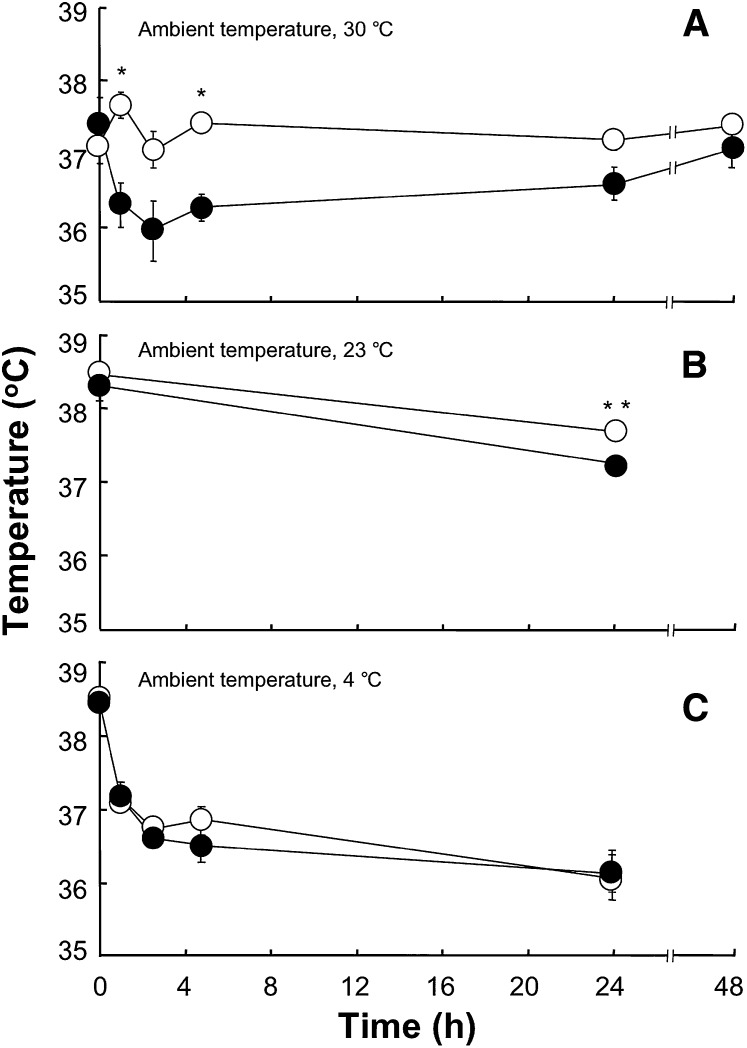
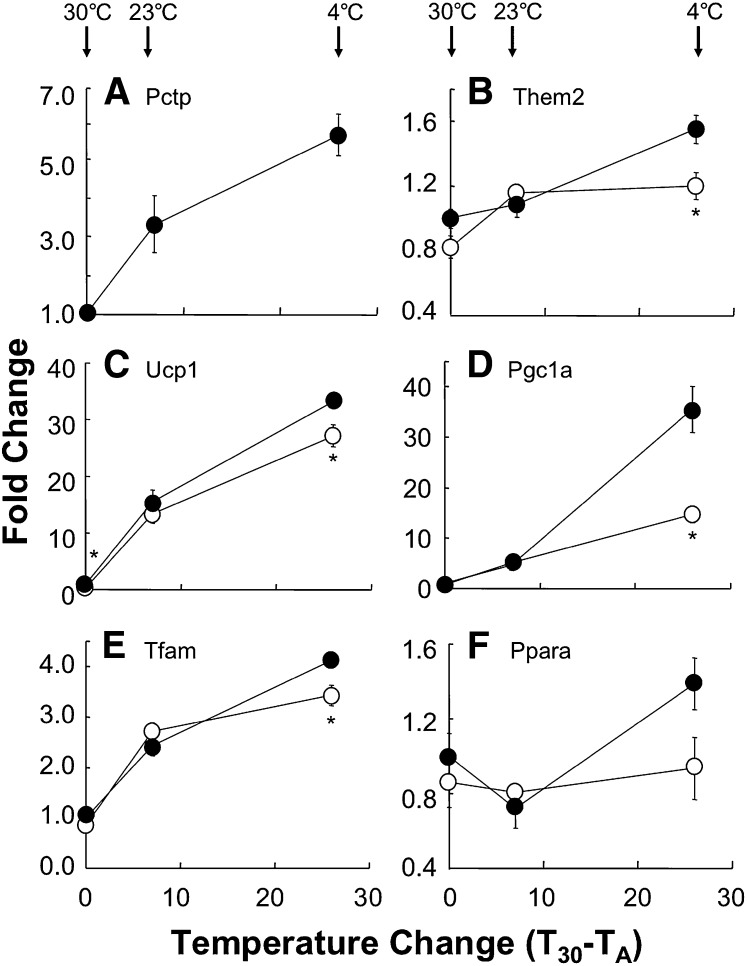
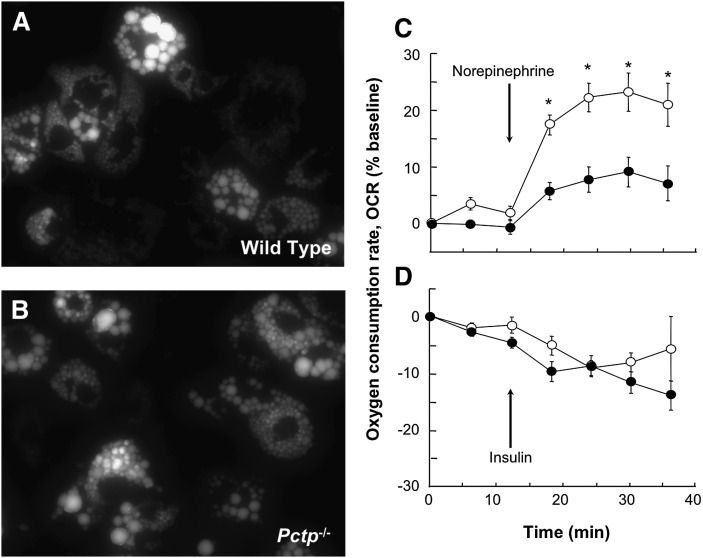
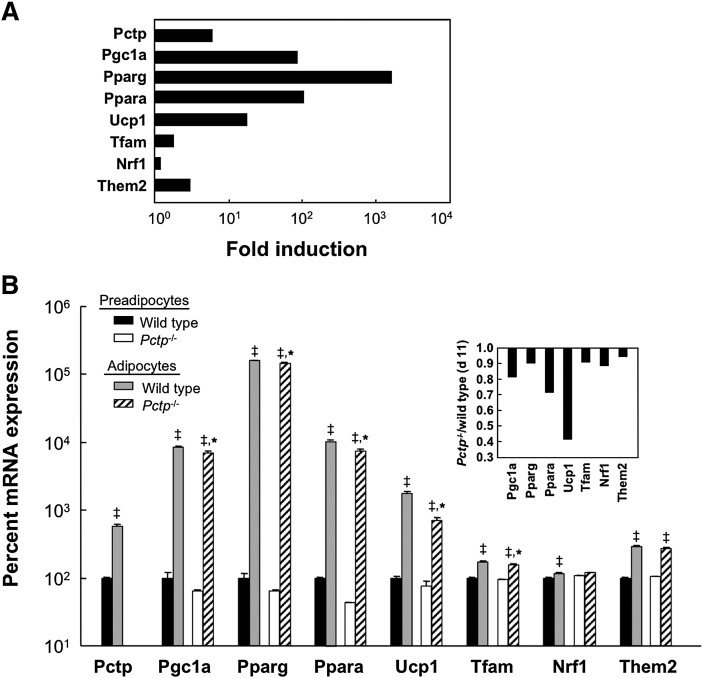
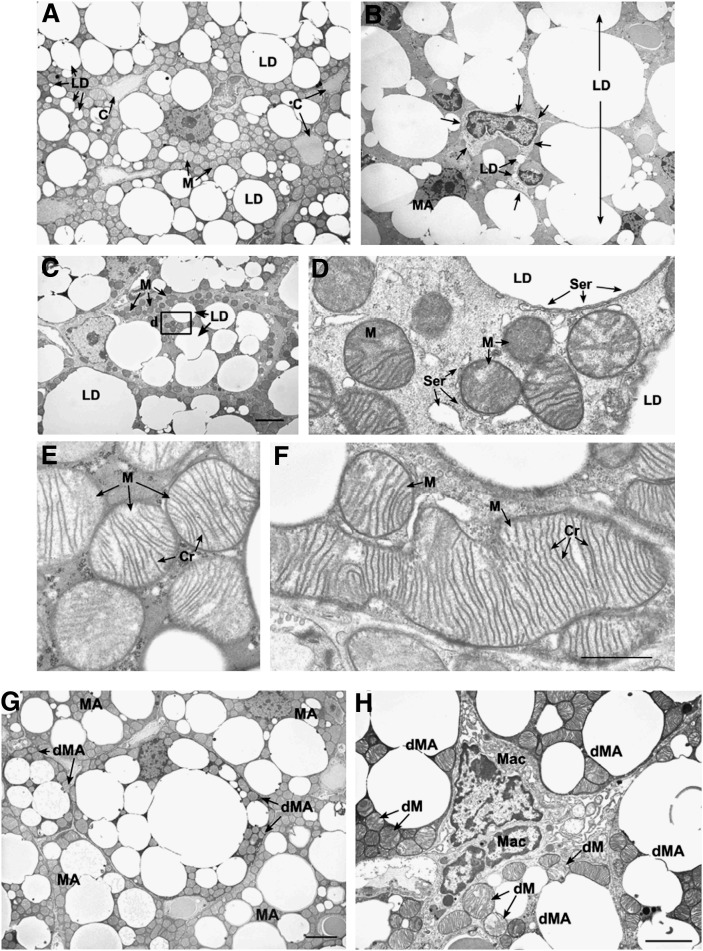
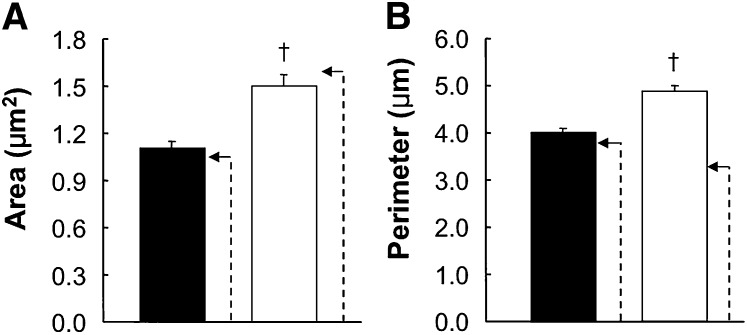
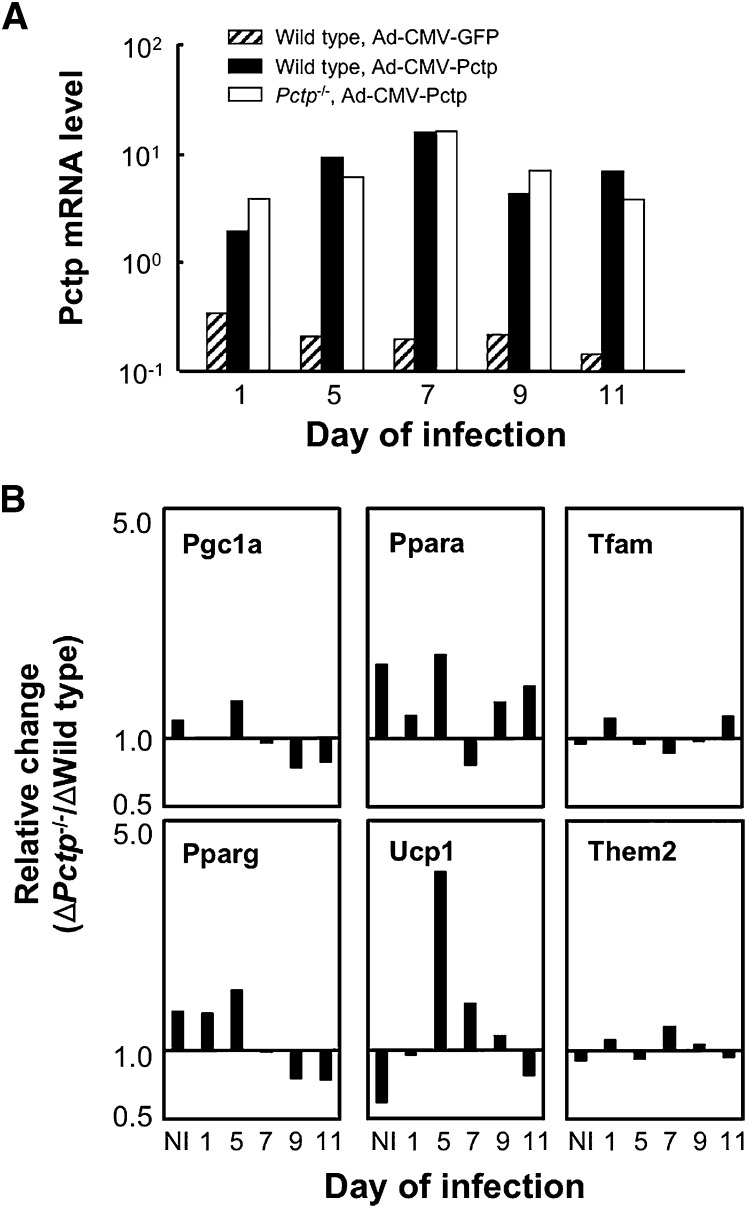
Pctp(-/-) mice that lack phosphatidylcholine transfer protein (Pctp) exhibit a marked shift toward utilization of fatty acids for oxidative phosphorylation, suggesting that Pctp may regulate the entry of fatty acyl-CoAs into mitochondria. Here, we examined the influence of Pctp expression on the function and structure of brown adipose tissue (BAT), a mitochondrial-rich, oxidative tissue that mediates nonshivering thermogenesis. Consistent with increased thermogenesis, Pctp(-/-) mice exhibited higher core body temperatures than wild-type controls at room temperature. During a 24 h cold challenge, Pctp(-/-) mice defended core body temperature efficiently enough that acute, full activation of BAT thermogenic genes did not occur. Brown adipocytes lacking Pctp harbored enlarged and elongated mitochondria. Consistent with increased fatty acid utilization, brown adipocytes cultured from Pctp(-/-) mice exhibited higher oxygen consumption rates in response to norepinephrine. The absence of Pctp expression during brown adipogenesis in vitro altered the expression of key transcription factors, which could be corrected by adenovirus-mediated overexpression of Pctp early but not late during the differentiation. Collectively, these findings support a key role for Pctp in limiting mitochondrial oxidation of fatty acids and thus regulating adaptive thermogenesis in BAT.


Figures

Fig. 1.
Fig. 1.
Expression of Pctp and Them2 in brown fat. Western blot analysis using homogenates of brown fat harvested from FVB/NJ wild-type and Pctp−/− mice. The blot was also probed with β-actin to verify equal loading.
Fig. 2.
Fig. 2.
Influence of Pctp expression and ambient temperature on core body temperatures of mice. Core body temperature was measured for wild-type (closed circles) and Pctp−/− (open circles) mice maintained at 30°C (A; wild type, n = 5; Pctp−/−, n = 5), 23°C (B; wild-type, n = 7; Pctp−/−, n = 11), and 4°C (C; wild type, n = 6; Pctp−/−, n = 9). Where not visible, error bars are contained within symbol sizes. *P < 0.05, Pctp−/− versus wild type; **P < 0.006, Pctp−/− versus wild-type.
Fig. 3.
Fig. 3.
Attenuated thermal stress-induced gene induction in brown fat of Pctp−/− mice. Upon conclusion of the experiments in Fig. 2, gene expression was measured in brown fat harvested from wild-type (closed circles) and Pctp−/− (open circles) mice (n = 4/group). Expression levels were normalized to values for wild type at 30°C and fold changes plotted as functions of the magnitude of ambient temperature (TA) reductions below 30°C (T30 − TA) for Pctp (A), Them2 (B), Ucp1 (C), Pgc1a (D), Tfam (E), and Ppara (F). The arrows indicate TA for each experiment. Where not visible, error bars are contained within symbol sizes. *P < 0.05, Pctp−/− versus wild type.
Fig. 4.
Fig. 4.
Normal appearance of lipid droplets but increased norepinephrine responsiveness in cultured brown adipocytes from Pctp−/− mice. Fluorescence microscopy was performed following BODIPY staining of fully differentiated brown adipocytes (day 11) cultured from wild-type (A) and Pctp−/− (B) mice. Following an initial equilibration period, 10 µM norepinephrine (C) or 10 nM insulin (D) were added, as indicated by the arrows. OCR was determined for differentiated primary brown adipocytes from wild-type (closed circles) and Pctp−/− (open circles) mice. Data points represent means of 10 wells and are representative of two independent experiments. Where not visible, error bars are contained within symbol sizes. * P < 0.05, Pctp−/− versus wild type.
Fig. 5.
Fig. 5.
Absence of Pctp expression alters gene expression during differentiation of brown preadipocytes in vitro. A: Fold changes in expression of selected genes during differentiation of wild-type brown preadipocytes into mature brown adipocytes. Data represent expression of mRNA in differentiated brown adipocytes on day 11 relative to expression prior to differentiation on day 2 and are plotted on a logarithmic scale. B: Influence of Pctp on gene expression in brown preadipocytes (black bars, wild type; white bars, Pctp−/−) and in mature brown adipocytes (gray bars, wild type; cross-hatched bars, Pctp−/−). P < 0.05, adipocytes versus preadipocytes, *P < 0.05, Pctp−/− versus wild type. Measurements were performed in duplicate on each RNA sample of two RNA samples per group and plotted on a logarithmic scale. For each gene, the inset demonstrates the ratio of the mean mRNA expression on day 11 for Pctp−/− mice to mean expression for wild-type mice on day 11. Values of mRNA expression were obtained by normalizing to mRNA levels of a reference gene (Rpl32).
Fig. 6.
Fig. 6.
Influence of Pctp expression on the ultrastructure of brown fat. The top series of electron micrographs show that the absence of Pctp expression leads to the presence of immature adipocytes and mitochondrial changes in brown fat. Characteristics of brown fat from wild-type (A, E) or Pctp−/− mice (B, C, D, F). A: Mature brown adipocytes in wild-type mice. LD, lipid droplet; C, blood capillary; M, mitochondria. B: Developing protoadipocyte at the same magnification as in A. LD, lipid droplet (two in protoadipocyte and one large fused large droplet); MA, mature adipocytes. Arrows mark the boundary of the protoadipocyte. C: Developing preadipocyte at the same magnification as in A. LD, lipid droplet; M, mitochondria. Bar in C applies to A–C and represents 4 µm. D: High magnification of the area in the box in C. Note that smooth endoplasmic reticulum (Ser) is found along the edge of the lipid droplet (LD), surrounding mitochondria (M), and in the cell cytoplasm. E: Mitochondria from control adipocytes (in A). Note that mitochondria (M) have a pale matrix and numerous cristae (Cr) that are well organized. F: Mitochondria from Pctp−/− mouse that is the same magnification as in E. Note the large size of mitochondria (M) and the large number of parallel cristae (Cr). Bar in F applies to D–F and represents 1 µm. The bottom pair of electron micrographs demonstrates that degenerating adipocytes are present in brown fat from Pctp−/− mice. G: Degenerating mature adipocytes (dMA) were found among mature adipocytes (MA) in the brown fat from Pctp−/− mice. The cytoplasm of degenerating brown adipocytes is electron dense in comparison to mature adipocytes. Bar represents 4 µm. H: The intercellular space between degenerating mature adipocytes (dMA) in brown fat from Pctp−/− mice is expanded, and macrophages (Mac) can be found in close association with the degenerating cells. In addition to electron-dense cytoplasm in degenerating mature adipocytes, mitochondria have an abnormal structure with disrupted cristae, pale matrix, and defects in shape (dM). Bar represents 6 µm.
Fig. 7.
Fig. 7.
Enlarged, elongated, and irregular mitochondria in mature brown adipocytes in BAT from Pctp−/− mice. Mitochondria in mature brown adipocytes in brown fat from two wild-type mice (closed bars) and two Pctp−/− mice (open bars) were analyzed by electron microscopy in order to quantify area (A) and perimeter (B). The dashed arrows indicate calculated values using means of height and width (see text) based on the assumption that mitochondria were elliptical. P < 0.001, Pctp−/− versus wild-type.
Fig. 8.
Fig. 8.
Influence of Pctp overexpression on differentiation of brown adipocytes. A: Expression levels of Pctp mRNA on day 11 for wild-type cells infected with Ad-CMV-GFP (hatched bars) or Ad-CMV-Pctp (closed bars) and Pctp−/− cells infected with Ad-CMV-Pctp (open bars). Relative mRNA expression values were obtained by normalizing to expression of the reference gene, Rpl32, and are plotted on a logarithmic scale. B: Influence of Pctp overexpression on gene induction. Relative changes are expressed as the ratio of fold induction for Pctp−/− brown adipocytes (Fold ΔPctp−/−) to the fold induction of wild-type mice (Fold Δwild-type) for each transcript. Gene expression relative to Rpl32 was normalized by expression of the same gene in cells infected on the same day with Ad-CMV-GFP relative to Rpl32. Fold induction was calculated as the ratio of fold change on day 11 following differentiation relative to expression on day 2 prior to differentiation and are plotted on a logarithmic scale. NI indicates no adenoviral infection.

References

    1. Ponting C. P., Aravind L. 1999. START: a lipid-binding domain in StAR, HD-ZIP and signalling proteins. Trends Biochem. Sci. 24: 130–132. - PubMed
    1. Roderick S. L., Chan W. W., Agate D. S., Olsen L. R., Vetting M. W., Rajashankar K. R., Cohen D. E. 2002. Structure of human phosphatidylcholine transfer protein in complex with its ligand. Nat. Struct. Biol. 9: 507–511. - PubMed
    1. Alpy F., Tomasetto C. 2005. Give lipids a START: the StAR-related lipid transfer (START) domain in mammals. J. Cell Sci. 118: 2791–2801. - PubMed
    1. Soccio R. E., Breslow J. L. 2003. StAR-related lipid transfer (START) proteins: mediators of intracellular lipid metabolism. J. Biol. Chem. 278: 22183–22186. - PubMed
    1. Tsujishita Y., Hurley J. H. 2000. Structure and lipid transport mechanism of a StAR-related domain. Nat. Struct. Biol. 7: 408–414. - PubMed

Publication types

MeSH terms