. 2009 Jul;12(7):829-38.
doi: 10.1038/nn.2333. Epub 2009 Jun 7.

HDAC1 and HDAC2 regulate oligodendrocyte differentiation by disrupting the beta-catenin-TCF interaction

Affiliations

HDAC1 and HDAC2 regulate oligodendrocyte differentiation by disrupting the beta-catenin-TCF interaction

Feng Ye et al. Nat Neurosci. 2009 Jul.

Erratum in

Abstract

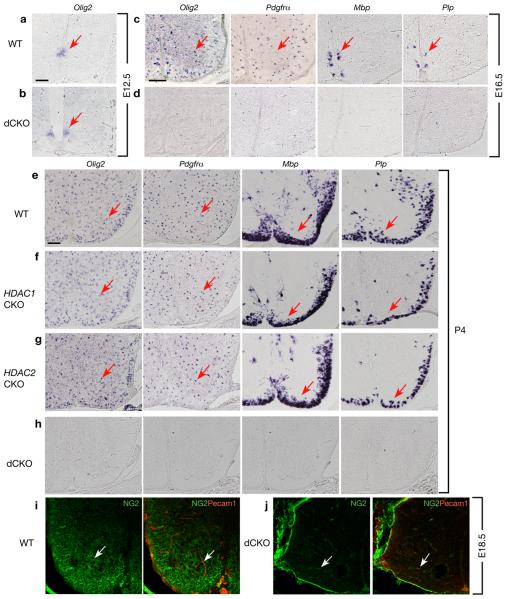
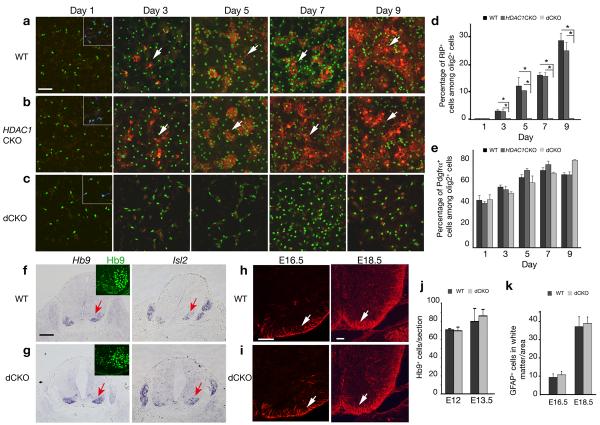
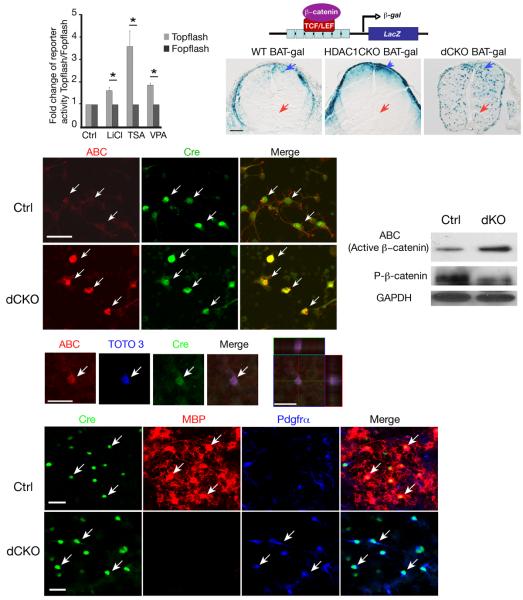
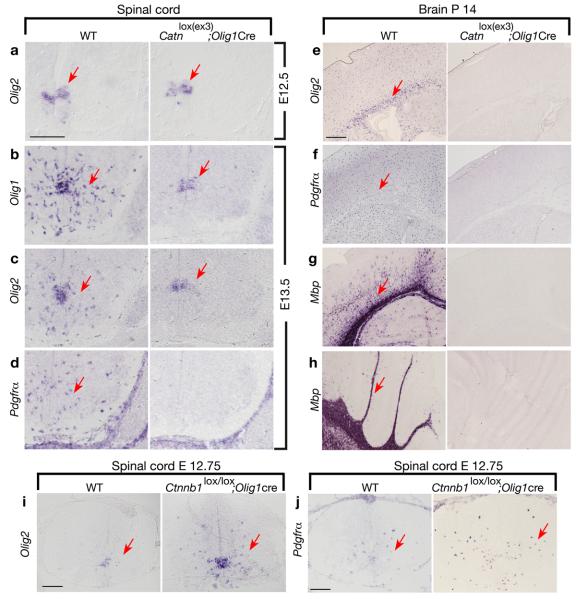
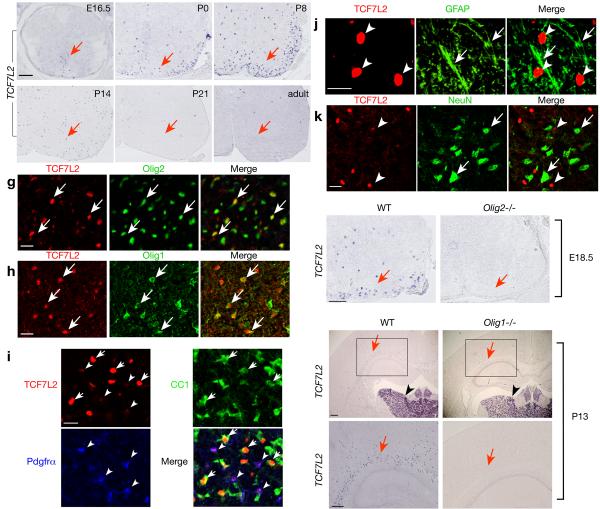
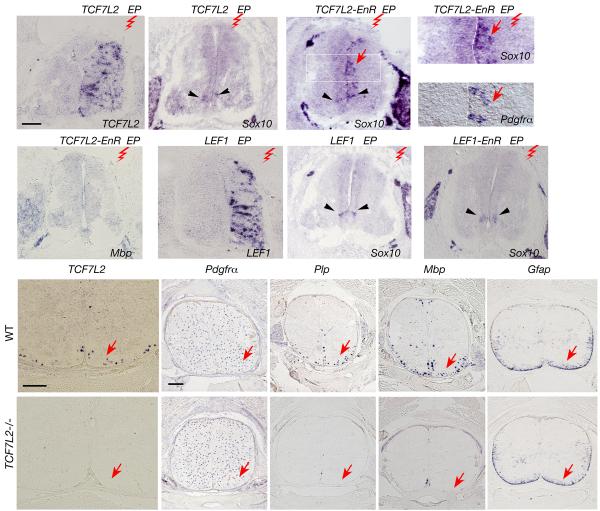
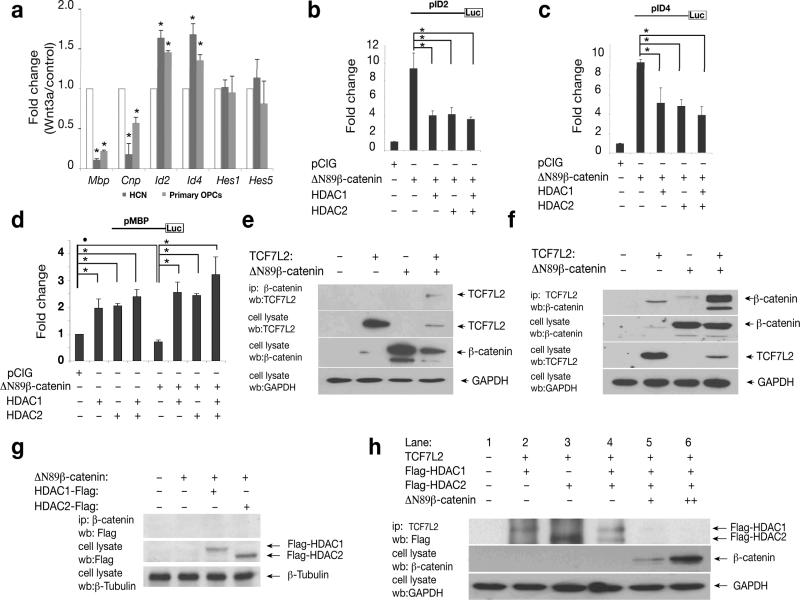
Oligodendrocyte development is regulated by the interaction of repressors and activators in a complex transcriptional network. We found that two histone-modifying enzymes, HDAC1 and HDAC2, were required for oligodendrocyte formation. Genetic deletion of both Hdac1 and Hdac2 in oligodendrocyte lineage cells resulted in stabilization and nuclear translocation of beta-catenin, which negatively regulates oligodendrocyte development by repressing Olig2 expression. We further identified the oligodendrocyte-restricted transcription factor TCF7L2/TCF4 as a bipartite co-effector of beta-catenin for regulating oligodendrocyte differentiation. Targeted disruption of Tcf7l2 in mice led to severe defects in oligodendrocyte maturation, whereas expression of its dominant-repressive form promoted precocious oligodendrocyte specification in developing chick neural tube. Transcriptional co-repressors HDAC1 and HDAC2 compete with beta-catenin for TCF7L2 interaction to regulate downstream genes involved in oligodendrocyte differentiation. Thus, crosstalk between HDAC1/2 and the canonical Wnt signaling pathway mediated by TCF7L2 serves as a regulatory mechanism for oligodendrocyte differentiation.


Figures

Figure 1
Figure 1. HDAC1 and HDAC2 are required for oligodendrocyte development in the spinal cord
In situ hybridizations of cross-sections of spinal cord from wild-type (WT) (a, c, e), HDAC1lox/lox; Olig1-Cre (HDAC1CKO; f), HDAC2 lox/lox; Olig1-Cre (HDAC2CKO; g), HDAC1/2lox/lox; Olig1-Cre (dCKO; b, d, h) at ages E12.5, E16.5, or P4 as indicated using probes for oligodendrocyte lineage markers Olig2, Pdgfrα, Plp/DM20, and Mbp. i-j, spinal cords from WT and dCKO at e18.5 were subject to double immunostaining with anti-NG2 (green) and anti-PECAM1 (red) antibodies. The anti-PECAM1 was used to distinguish OPCs from pericytes since NG2 labels both OPCs and pericytes within the spinal cord. Arrows indicate in situ labeled cells (a-h) and NG2+ or PECAM1+ cells (i-j), respectively. Scale bars in a-b, c-d and e-j, 100 μm.
Figure 2
Figure 2. HDAC1 and HDAC2 are essential for oligodendrocyte differentiation in vitro and is not required for motor neurons and astrocyte development
a-c) Cortical progenitors from WT, HDAC1CKO; and dCKO embryos at E15.5 were cultured in oligodendrocyte differentiation media. Cells were immunostained antibodies to RIP, Olig2 and Pdgfrα at defined days as indicated. Pdgfrα expression (blue). was detected in control and dCKO culture shown as inserts in panels. d-e) Histographs depict the percentage of RIP+ (d) or Pdgfrα+ (e) cells among Olig2+ cells. Data are derived from experiments in parallel cultures of at least three age-matching littermates. *p<0.01, ANOVA in post hoc Newman-Keuls Multiple comparison test. f-g) In situ hybridization of transverse sections of ventral spinal cord from WT and dCKO at E12.5 using probes for motor neuron markers Hb9 and Isl2. Motor neurons in the ventral horn immunolabeled by an Hb9 (green) antibody were shown as inserts. h-i) Immunostaining of spinal cord of WT and dCKO at E16.5 and E18.5 using GFAP antibody. j) Quantification of Hb9+ cells per section was shown in the spinal cord of WT and dCKO at E12 and E13.5 (n=3). k) Quantification of GFAP+ cells was shown in the white matter of WT and dCKO spinal cords per unit area (0.1 mm2) at E16.5 and E18.5 (n=3). All values are presented as mean ± SD in the graphs. Arrows indicate immuno- or in situ labeling cells. Scale bar in a-c: 50 μm; in f-g: 200 μm, and in h-i; 100 μm.
Figure 3
Figure 3. Activation of Wnt signaling by stabilizing β-catenin in HDAC1 and HDAC2 mutant progenitors
a) HCN cells were transfected with TOPFLASH and FOPFLASH treated with LiCl and TSA (100 nM) and VPA (100 μM) for 48hr. Fold changes of the reporter activity of TOPFLASH relative to FOPFLASH were presented. Data are derived from three independent experiments with error bars representing mean±SD (*P<0.01, Student's twotailed t test). b) A schematic diagram is shown for a BAT-gal reporter line under the control of β-catenin/TCF. c-e) β-galactosidase (β-gal) expression in the E13.5 spinal cord is shown in WT;BAT-gal and HDAC1CKO;BAT-gal and dCKO;BAT-gal mice. Arrows indicate β-gal expressing cells. f-k) Immunostain of cortical progenitors from E15.5 HDAC1/2 flox/+;Olig1Cre (Ctrl) and dCKO embryos cultured in oligodendrocyte growth medium, using antibodies to a stable active form of β-catenin (ABC, red) and Cre (green). Arrows indicate Olig1-Cre+ cells and ABC expression (i-k,). l-p) Confocal imaging showed that ABC accumulation (arrow) in dCKO Cre+ cells in the nucleus visualized with TOTO3 nuclear staining dye. Orthogonal reconstructions of confocal images at the z-axis level were shown in side panels (p). q) Lysates of oligodendrocyte enriched culture from HDAC1/2 flox/+;Olig1Cre and dCKO embryos at E15.5 were subject to Western blot analysis for a stable form (ABC) or a phosphorylated form of β-catenin as indicated. r-y) Immunostaining of oligodendrocyte-enriched culture from HDAC1lox/+; Olig1-Cre (Ctrl; r-u) and dCKO embryos using antibodies to Cre (green), MBP (red), and Pdgfrα (blue). Arrows indicate Cre+ cells. Scale bars in c-e:100 μm; in f-o and r-v: 50 μm.
Figure 4
Figure 4. Activation of canonical Wnt signaling in oligodendrocyte lineage cells inhibits oligodendrocyte differentiation
a-h) In situ hybridization of sections of spinal cord (a-d), forebrain (e-g) or cerebellum (h) taken from WT, Catnlox(ex3); Olig1Cre mice at indicated ages using probes to Olig2, Olig1, Pdgfrα, Plp, and Mbp. i-j) In situ hybridization of spinal cord sections of from WT and β-catenin KO (Ctnnb1lox/lox; Olig1Cre) mice at age E12.75 using probes to Olig2 and Pdgfrα as indicated. Arrows indicate the in situ labeled cells. Scale bars in a-d, e-h and i-j:100 μm.
Figure 5
Figure 5. Identification of Wnt/β-catenin effector TCF7L2 as an oligodendrocyte-specific transcription factor
a-f) In situ hybridization of transversed sections of spinal cord from WT at different ages as indicated using a probe to TCF7L2. g-k) Immunostain of P7 spinal cord using antibodies to TCF7L2, Olig2, Olig1, Pdgfrα, CC1, GFAP and NeuN as indicated. In panels g-i, arrows show co-labeling of TCF7L2 with Olig2 (g), Olig1 (h), CC1 (i). Arrowheads in i indicate Pdgfrα+/TCF7L2+ OPCs (arrowheads). TCF7L2 (arrowheads) was not detected in GFAP+ astrocytes (j, arrows) or NeuN+ neurons (k, arrows). l-q) In situ hybridization of spinal cord of WT and Olig2-/- mice at e18.5 or at forebrain of Olig1 null mice at P13 using a TCF7L2 probe. Arrow in l indicates TCF7L2 expressing cells in the lateral white matter, which is absent in Olig2 null animals (m). Arrows and arrowheads in n-q indicate TCF7L2 expression in the cerebral white matter region and neuronal populations in the thalamus, respectively. The boxed areas in n and o were showed in a high magnification in p and q, respectively. Scale bars in a-f, in g-k, 100 μm and l-q, 200 μm.
Figure 6
Figure 6. A dominant-repressive form of TCF7L2 promotes ectopic and precocious oligodendrocyte specification
a-f) Expression vectors for TCF7L2 or TCF7L2-EnR were electroporated into the neural tube of E2.5 chick embryos and harvested at E5.5. The spinal cord sections were analyzed by in situ hybridization with probes to TCF7L2 (a), Sox10 (b-d), Pdgfrα (e) and Mbp (f) as indicated. Red zigzags indicate the electroporated side (EP). The boxed area in c is shown with a larger magnification in d. Arrows in c-e indicate ectopic expression of Sox10 and Pdgfrα detected on the electroporated side of chick neural tubes. g-i) In situ hybridization analysis in the chick neural tube electroporated with LEF1 (g, h) and LEF1-EnR (i) with probes to LEF1 (g) and Sox10 (h,i). Arrowheads in a-i indicate endogenous Sox10 expression. j-s) Expression of mRNA transcripts for TCF7L2 (j,o), Pdgfrα (k,p), Plp (l,q), and Mbp (m,r) and Gfap (n,s) was analyzed in situ on spinal cord sections of WT and TCF7L2 null animals at E17.5 as indicated by arrows. Scale bars in a-c and f-i: 100 μm; in j,o and k-s: 200 μm.
Figure 7
Figure 7. Competition between β-catenin and HDAC1/2 proteins for TCF7L2 interaction regulates expression of Wnt target genes
a) HCN cells and primary rat OPCs were treated with Wnt signaling ligand Wnt3a (100ng/ml) for 48 hours. Expression of Mbp, Cnp, Id2/4, Hes1 and Hes5 were examined by qRT-PCR analysis. Gapdh served an internal control. b-d) HCN cells were transfected with vectors carrying ID2 (b) or ID4 (c) or MBP (d) promoter-driven luciferase reporters together with pCIG-△N89β-catenin and HDAC1, or HDAC2 or both HDAC1/2 as indicated. The luciferase activity of transfected cell lysates was measured 48 hr posttransfection. Values in a-d represent the average of three independent experiments. Error bars shown are the mean ± S.D. (•P<0.05, *P<0.01, ANOVA in post hoc Newman-Keuls Multiple comparison test). e-g) Expression vector encoding △N89β-catenin was cotransfected with TCF7L2 (e-f), or flag-tagged HDAC1 or HDAC2 (g) and individual controls. Co-immunoprecipitation with anti-△N89β-catenin (e) or anti-TCF7L2 (f) was performed from cell lysates 48 hr after transfection. h) TCF7L2 was co-transfected with expression vectors for △N89β-catenin and HDAC1 or/and HDAC2 as indicated. The TCF7L2 complex was immunoprecipitated with TCF7L2 antibody. Lane 2-4, in the absence of β-catenin, both HDAC1 and 2 were detected in the TCF7L2 complex. Lanes 5, in the presence of a low level of △N89β-catenin, flag-tagged HDAC 1 but not HDAC2 was detected in the TCF7L2 complex. Lane 6, in the presence of high level of β-catenin, neither HDAC1 nor HDAC2 was observed to be associated with the TCF7L2 complex.

Comment in

References

    1. Hsieh J, Gage FH. Chromatin remodeling in neural development and plasticity. Curr Opin Cell Biol. 2005;17:664–671. - PubMed
    1. Gregoretti IV, Lee YM, Goodson HV. Molecular evolution of the histone deacetylase family: functional implications of phylogenetic analysis. J Mol Bio. 2004;338:17–31. - PubMed
    1. Marin-Husstege M, Muggironi M, Liu A, Casaccia-Bonnefil P. Histone deacetylase activity is necessary for oligodendrocyte lineage progression. J Neurosci. 2002;22:10333–10345. - PMC - PubMed
    1. Shen S, Li J, Casaccia-Bonnefil P. Histone modifications affect timing of oligodendrocyte progenitor differentiation in the developing rat brain. J Cell Biol. 2005;169:577–589. - PMC - PubMed
    1. Cunliffe VT, Casaccia-Bonnefil P. Histone deacetylase 1 is essential for oligodendrocyte specification in the zebrafish CNS. Mech Dev. 2006;123:24–30. - PubMed

Publication types

MeSH terms