. 2009 May;5(5):e1000488.
doi: 10.1371/journal.pgen.1000488. Epub 2009 May 29.

Genome-wide fitness and expression profiling implicate Mga2 in adaptation to hydrogen peroxide

Affiliations

Genome-wide fitness and expression profiling implicate Mga2 in adaptation to hydrogen peroxide

Ryan Kelley et al. PLoS Genet. 2009 May.

Abstract

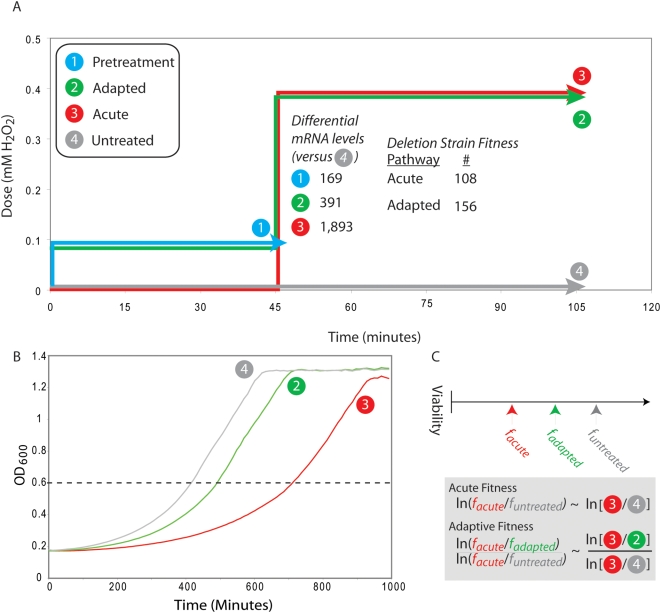
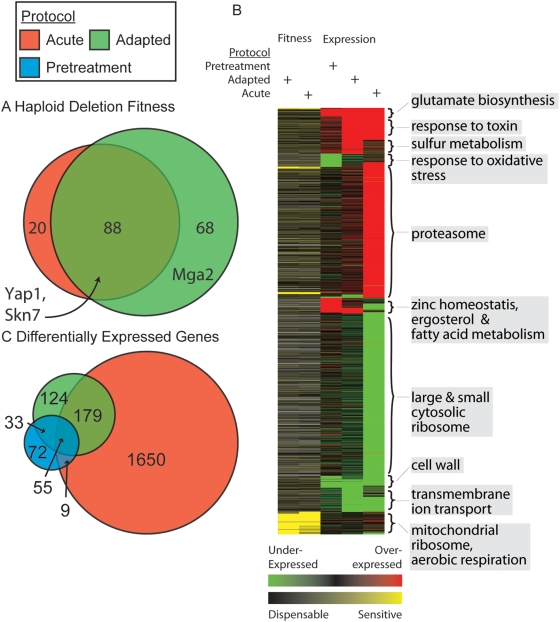
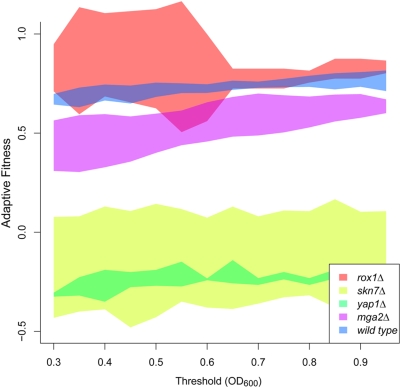
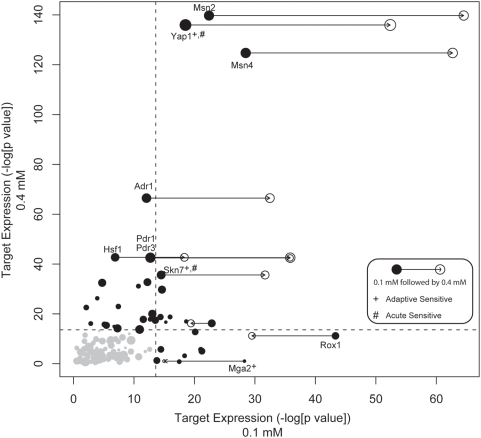
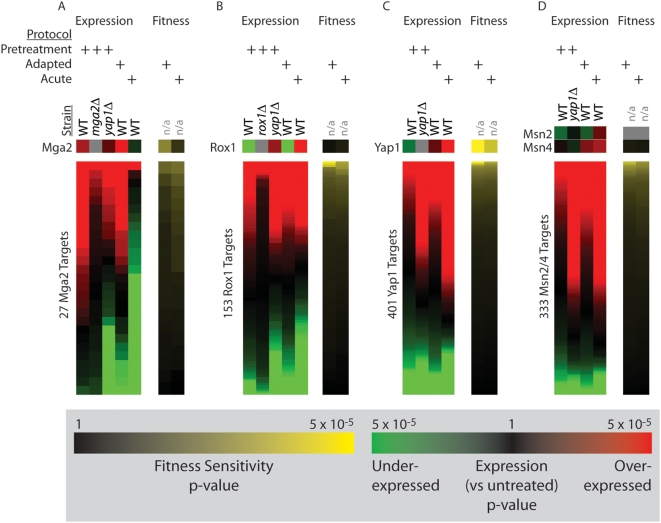
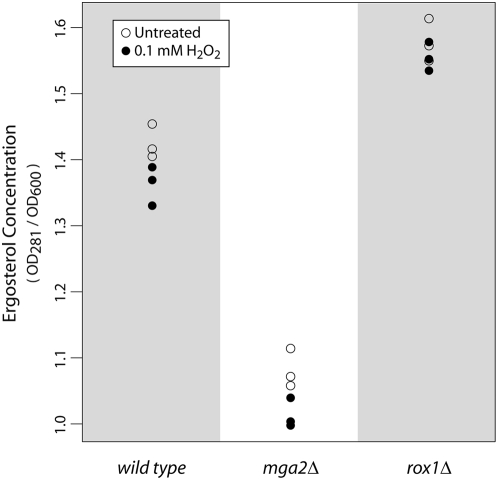
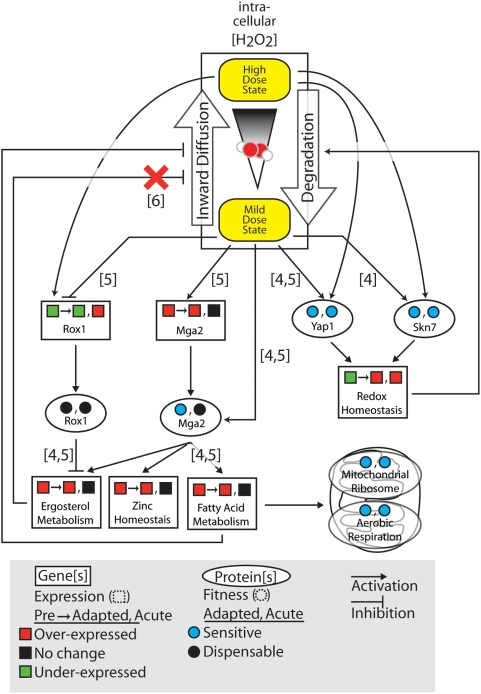
Caloric restriction extends lifespan, an effect once thought to involve attenuation of reactive oxygen species (ROS) generated by aerobic metabolism. However, recent evidence suggests that caloric restriction may in fact raise ROS levels, which in turn provides protection from acute doses of oxidant through a process called adaptation. To shed light on the molecular mechanisms of adaptation, we designed a series of genome-wide deletion fitness and mRNA expression screens to identify genes involved in adaptation to hydrogen peroxide. Combined with known transcriptional interactions, the integrated data implicate Yap1 and Skn7 as central transcription factors of both the adaptive and acute oxidative responses. They also identify the transcription factors Mga2 and Rox1 as active exclusively in the adaptive response and show that Mga2 is essential for adaptation. These findings are striking because Mga2 and Rox1 have been thought to control the response to hypoxic, not oxidative, conditions. Expression profiling of mga2Delta and rox1Delta knockouts shows that these factors most strongly regulate targets in ergosterol, fatty-acid, and zinc metabolic pathways. Direct quantitation of ergosterol reveals that its basal concentration indeed depends on Mga2, but that Mga2 is not required for the decrease in ergosterol observed during adaptation.


Conflict of interest statement

The authors have declared that no competing interests exist.

Figures

Figure 1
Figure 1. Study design.
A. Yeast cells were collected following each of four hydrogen peroxide treatment conditions (pretreated, adapted, acute, and untreated, labeled 1–4). Competitive growth experiments were performed between gene deletion pools grown in adapted versus acute conditions (to identify genes required specifically for adaptation) and between pools grown in acute versus untreated conditions (to identify genes required for the acute response). Gene expression profiling was performed in either adapted or acute conditions versus untreated cells. B. Profiling of wild type growth reveals that pretreatment with mild hydrogen peroxide (green) leads to improved recovery to an OD600 threshold (dashed line) compared to no pretreatment (red) following a high dose of hydrogen peroxide. An enlarged version of panel B is available as Figure S1. C. For an individual gene deletion, the acute sensitivity is defined as the difference between the acute and untreated viability. The adapted sensitivity is the fraction of that difference that is recovered by mild pretreatment with hydrogen peroxide.
Figure 2
Figure 2. Fitness and expression profiling overview.
A. Numbers and overlap of gene deletions that are sensitive in the adaptive (green) and acute (red) treatment protocols. B. Hierarchical clustering of the differentially expressed or sensitive genes from each screen. Clusters are annotated at right with over-represented functional groups. C. Numbers and overlap of differentially expressed genes identified in each of the three expression treatment protocols.
Figure 3
Figure 3. Confirmation of mutant strains deficient in adaptation.
Growth curves in untreated, adapted, and acute oxidative conditions were measured for wild type and each of four deletion strains starting from single-cell colonies. These curves were used to compute adaptive fitness (y-axis) which is shown over a range of OD600 threshold values (x-axis, see Methods). For all thresholds, an adaptation defect compared to wild type was confirmed for yap1Δ, skn7Δ, mga2Δ (all p<5.0×10⁻² by unpaired t-test). No defect was observed for rox1Δ, which was also consistent with the genome-wide screen. Each colored band represents the range of adaptive fitness values spanned by the mean±2*standard error of multiple biological replicates.
Figure 4
Figure 4. Dynamics of transcription factor target expression in mild and acute conditions.
For each transcription factor, we compute a score based on a hypergeometric test representing the significance of increased expression (relative to untreated) of known targets (see Methods) following either pretreatment (0.1 mM H2O2, x-axis) or acute treatment (0.4 mM H2O2, y-axis). For those transcription factors with the most significant activity following pre- or acute treatment, the activity following adaptive treatment (0.1 mM followed by 0.4 mM H2O2) is also displayed on the x-axis with an open circle. The size of each point corresponds to the number of known targets of that transcription factor. The dotted lines indicate a threshold for significance determined by a randomization procedure (see Methods). Although there is significant overlap in the set of expressed genes following mild and acute treatment, examination of specific transcription factors reveals those with unique behavior in each condition. Transcription factors identified in the deletion fitness analysis of the acute and adaptive treatments are indicated with “#” and “+” symbols, respectively.
Figure 5
Figure 5. Expression analysis of deletion mutants validates the activation of key transcription factors in response to H2O2 pretreatment.
Panels A–D detail the behavior of the transcription factors Mga2, Rox1, Yap1, and Msn2/4 and their target sets, respectively. Each column represents the expression or fitness values in sorted order for a specific set of genes.
Figure 6
Figure 6. Dynamics of ergosterol following mild treatment with hydrogen peroxide.
Following an n-heptane extraction (see Methods), the presence of ergosterol is detected at 281 nm. The ergosterol concentration (relative to the number of cells [OD600 value] in the original culture) is reported for wild type, mga2Δ, and rox1Δ strains in three paired trials with and without mild hydrogen peroxide pretreatment.
Figure 7
Figure 7. Summary of the adaptive response.
Results and hypotheses regarding transcriptional regulators and functional categories identified in this study are summarized. The influence of hydrogen peroxide is determined by its concentration within the cell. In addition to treatment dose, several cellular processes affect the level of H2O2. In order to enter the cell, hydrogen peroxide must first diffuse across the plasma membrane. Inside the cell, peroxide levels are reduced by degradation into oxygen and water. Squares denote the expression of genes or gene sets (rectangles) following each of the three treatment protocols (pretreatment, adapted, and acute). Conversely, circles denote the sensitivity of the corresponding gene deletion for a particular protein or protein set (oval) in the adapted and acute treatment protocol. Arrows between different objects indicate either an activating (triangular arrowhead) or inhibitory (flat arrowhead) influence. The figure number(s) which provides support for each link are shown in brackets. A red “X” denotes a hypothesis which is refuted by experimental observation.

References

    1. Lusis AJ. Atherosclerosis. Nature. 2000;407:233–241. - PMC - PubMed
    1. Jenner P. Oxidative stress in Parkinson's disease. Ann Neurol. 2003;53(Suppl 3):S26–36. discussion S36–28. - PubMed
    1. Markesbery WR. Oxidative stress hypothesis in Alzheimer's disease. Free Radic Biol Med. 1997;23:134–147. - PubMed
    1. Christen Y. Oxidative stress and Alzheimer disease. Am J Clin Nutr. 2000;71:621S–629S. - PubMed
    1. Weindruch R, Naylor PH, Goldstein AL, Walford RL. Influences of aging and dietary restriction on serum thymosin alpha 1 levels in mice. J Gerontol. 1988;43:B40–42. - PubMed

Publication types

MeSH terms