

Meta-analysis of 28,141 individuals identifies common variants within five new loci that influence uric acid concentrations
- PMID: 19503597
- PMCID: PMC2683940
- DOI: 10.1371/journal.pgen.1000504
Meta-analysis of 28,141 individuals identifies common variants within five new loci that influence uric acid concentrations
Abstract
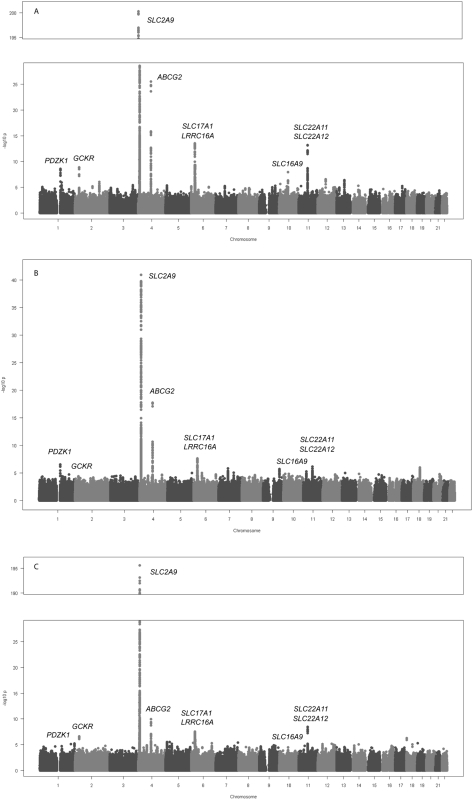
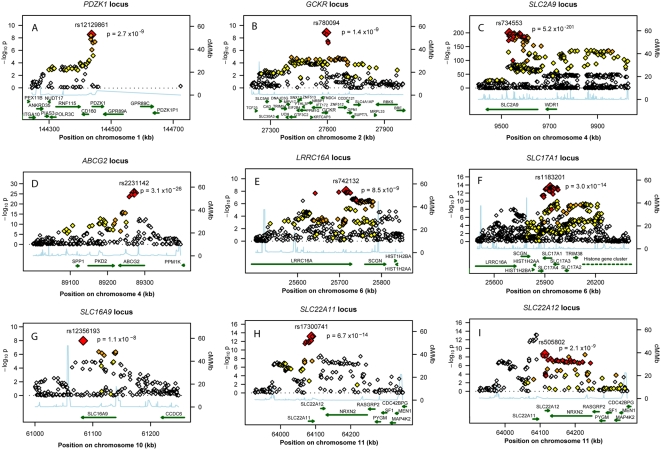
Elevated serum uric acid levels cause gout and are a risk factor for cardiovascular disease and diabetes. To investigate the polygenetic basis of serum uric acid levels, we conducted a meta-analysis of genome-wide association scans from 14 studies totalling 28,141 participants of European descent, resulting in identification of 954 SNPs distributed across nine loci that exceeded the threshold of genome-wide significance, five of which are novel. Overall, the common variants associated with serum uric acid levels fall in the following nine regions: SLC2A9 (p = 5.2x10(-201)), ABCG2 (p = 3.1x10(-26)), SLC17A1 (p = 3.0x10(-14)), SLC22A11 (p = 6.7x10(-14)), SLC22A12 (p = 2.0x10(-9)), SLC16A9 (p = 1.1x10(-8)), GCKR (p = 1.4x10(-9)), LRRC16A (p = 8.5x10(-9)), and near PDZK1 (p = 2.7x10(-9)). Identified variants were analyzed for gender differences. We found that the minor allele for rs734553 in SLC2A9 has greater influence in lowering uric acid levels in women and the minor allele of rs2231142 in ABCG2 elevates uric acid levels more strongly in men compared to women. To further characterize the identified variants, we analyzed their association with a panel of metabolites. rs12356193 within SLC16A9 was associated with DL-carnitine (p = 4.0x10(-26)) and propionyl-L-carnitine (p = 5.0x10(-8)) concentrations, which in turn were associated with serum UA levels (p = 1.4x10(-57) and p = 8.1x10(-54), respectively), forming a triangle between SNP, metabolites, and UA levels. Taken together, these associations highlight additional pathways that are important in the regulation of serum uric acid levels and point toward novel potential targets for pharmacological intervention to prevent or treat hyperuricemia. In addition, these findings strongly support the hypothesis that transport proteins are key in regulating serum uric acid levels.
Conflict of interest statement
Vincent Mooser and Dawn Waterworth are full-time employees of GlaxoSmithKline, a pharmaceutical company. Peter Vollenweider and Gerard Waeber received financial support from GlaxoSmithKline to build the CoLaus study.
Figures
References
-
- Taniguchi A, Kamatani N. Control of renal uric acid excretion and gout. Curr Opin Rheumatol. 2008;20:192–197. - PubMed
-
- Koenig W, Meisinger C. Uric acid, type 2 diabetes, and cardiovascular diseases: fueling the common soil hypothesis? Clin Chem. 2008;54:231–233. - PubMed
-
- Cutler RG. Urate and ascorbate: their possible roles as antioxidants in determining longevity of mammalian species. Arch Gerontol Geriatr. 1984;3:321–348. - PubMed
-
- Whitfield JB, Martin NG. Inheritance and alcohol as factors influencing plasma uric acid levels. Acta Genet Med Gemellol (Roma ) 1983;32:117–126. - PubMed
Publication types
MeSH terms
Substances
Grants and funding
- AA007535/AA/NIAAA NIH HHS/United States
- N01-AG-1-2109/AG/NIA NIH HHS/United States
- MC_U127561128/MRC_/Medical Research Council/United Kingdom
- FS/05/061/19501/BHF_/British Heart Foundation/United Kingdom
- PG02/128/BHF_/British Heart Foundation/United Kingdom
- G9521010D/MRC_/Medical Research Council/United Kingdom
- ARC_/Arthritis Research UK/United Kingdom
- WT_/Wellcome Trust/United Kingdom
- 076113/B/04/Z/WT_/Wellcome Trust/United Kingdom
- CZB/4/710/CSO_/Chief Scientist Office/United Kingdom
- G9521010/MRC_/Medical Research Council/United Kingdom
- R01 AA007535/AA/NIAAA NIH HHS/United States
- G0400874/MRC_/Medical Research Council/United Kingdom
LinkOut - more resources
Full Text Sources
Other Literature Sources
Molecular Biology Databases
