. 2009 Jun 2;4(6):e5763.
doi: 10.1371/journal.pone.0005763.

Detection of transgenerational spermatogenic inheritance of adult male acquired CNS gene expression characteristics using a Drosophila systems model

Affiliations

Detection of transgenerational spermatogenic inheritance of adult male acquired CNS gene expression characteristics using a Drosophila systems model

Abhay Sharma et al. PLoS One. .

Abstract

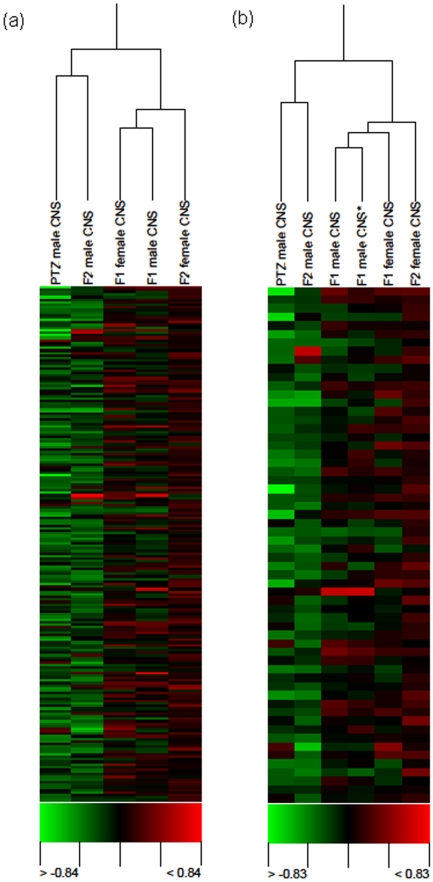
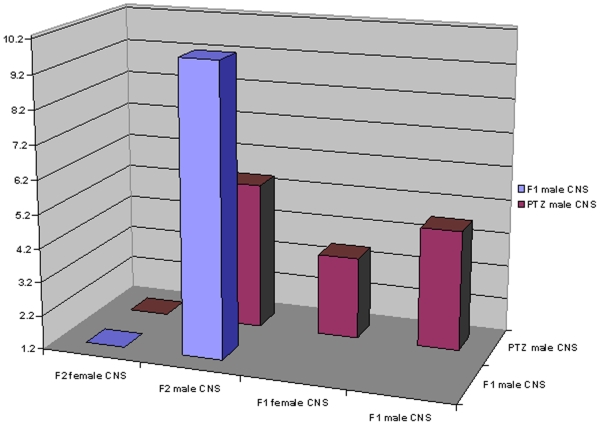
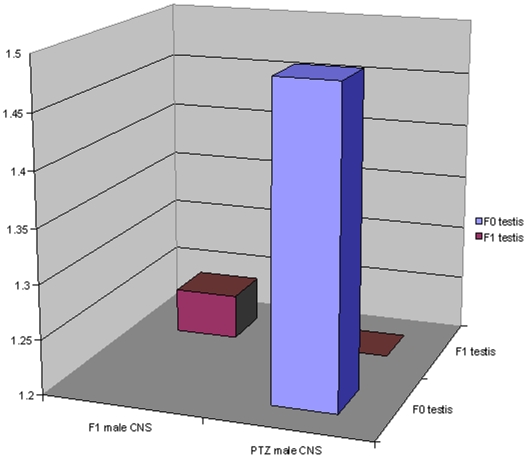
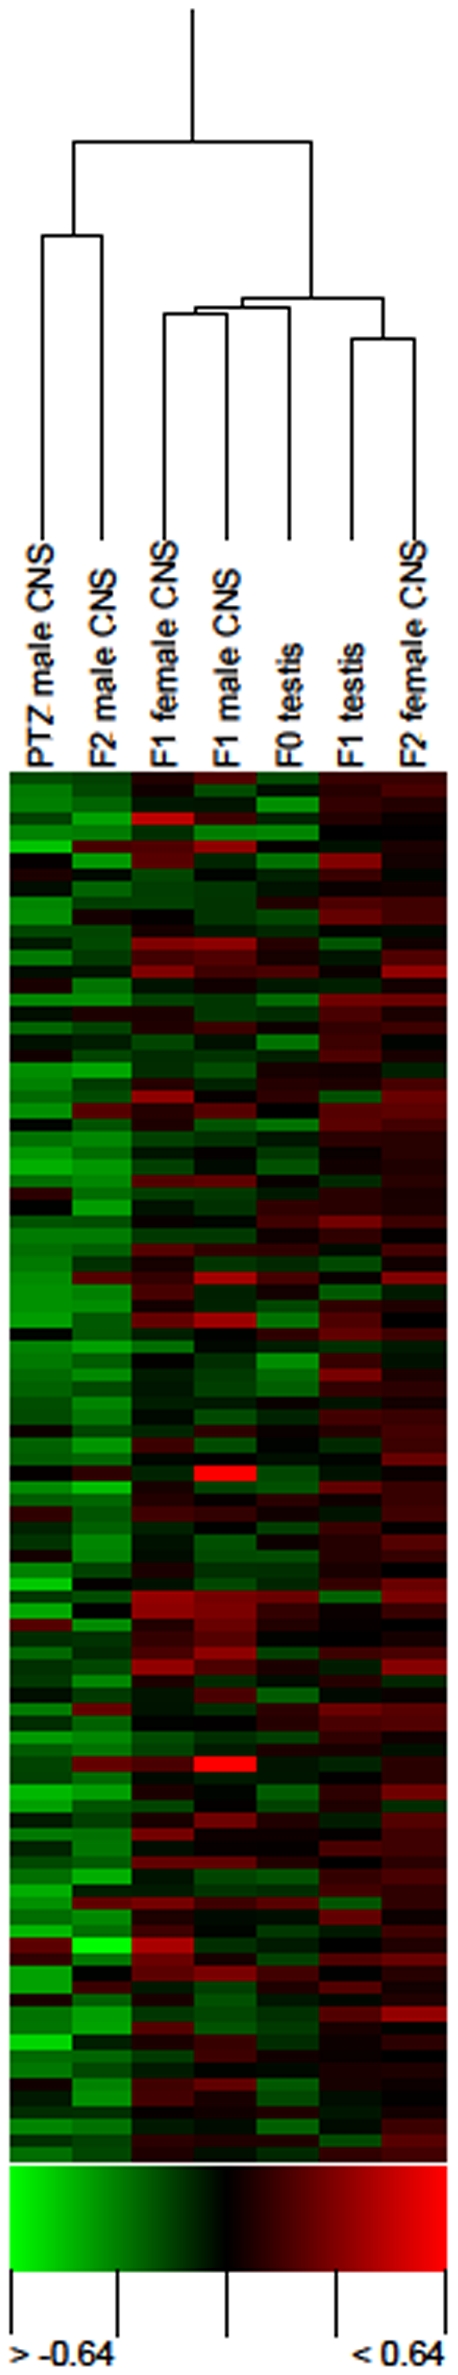
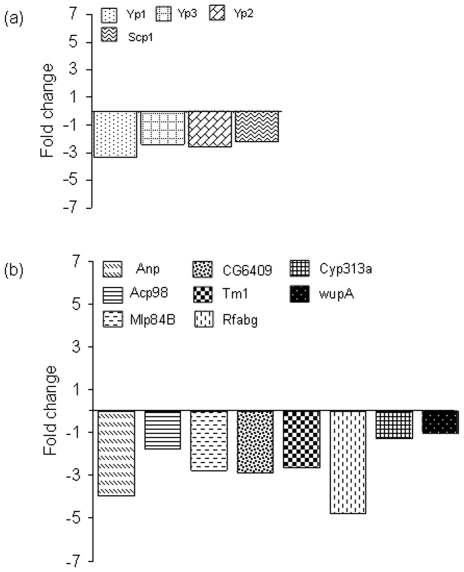
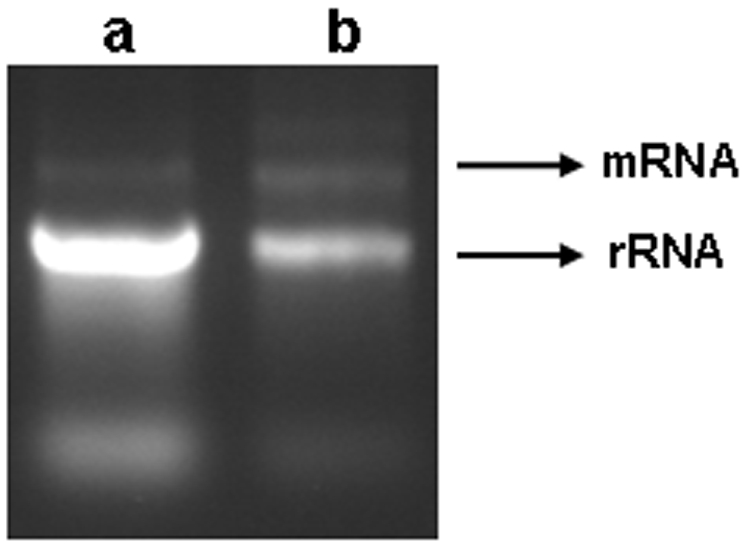
Available instances of inheritance of epigenetic transgenerational phenotype are limited to environmental exposures during embryonic and adult gonadal development. Adult exposures can also affect gametogenesis and thereby potentially result in reprogramming of the germline. Although examples of epigenetic effects on gametogenesis exist, it is notable that transgenerational inheritance of environment-induced adult phenotype has not yet been reported. Epigenetic codes are considered to be critical in neural plasticity. A Drosophila systems model of pentylenetetrazole (PTZ) induced long-term brain plasticity has recently been described. In this model, chronic PTZ treatment of adult males causes alterations in CNS transcriptome. Here, we describe our search for transgenerational spermatogenic inheritance of PTZ induced gene expression phenotype acquired by adult Drosophila males. We generated CNS transcriptomic profiles of F(1) adults after treating F(0) adult males with PTZ and of F(2) adults resulting from a cross between F(1) males and normal females. Surprisingly, microarray clustering showed F(1) male profile as closest to F(1) female and F(0) male profile closest to F(2) male. Differentially expressed genes in F(1) males, F(1) females and F(2) males showed significant overlap with those caused by PTZ. Interestingly, microarray evidence also led to the identification of upregulated rRNA in F(2) males. Next, we generated microarray expression profiles of adult testis from F(0) and F(1) males. Further surprising, clustering of CNS and testis profiles and matching of differentially expressed genes in them provided evidence of a spermatogenic mechanism in the transgenerational effect observed. To our knowledge, we report for the first time detection of transgenerational spermatogenic inheritance of adult acquired somatic gene expression characteristic. The Drosophila systems model offers an excellent opportunity to understand the epigenetic mechanisms underlying the phenomenon. The finding that adult acquired transcriptomic alteration in soma is spermatogenically inherited across generations has potential implications in human health and evolution.


Conflict of interest statement

Competing Interests: The authors have declared that no competing interests exist.

Figures

Figure 1
Figure 1. Hierarchical clustering of CNS expression profiles.
City Block similarity metric and average linkage methods were used for hierarchical clustering of arrays. The cluster was generated using Acuity 4.0 (Molecular Devices). Each time point represents mean of normalized log2 ratio (635/534) of four biological replicates with balanced dye-swaps. Note clustering of PTZ treated males' profile with their grandsons (a). Cluster shown in (b) represents all the profiles in (a) and a freshly generated F1 male profile. Reproducibility of expression profiling is evident from similarity between the two F1 male profiles (b). PTZ profile shown here was derived from previously reported microarray data related to seven days of drug treatment. * indicates replication set.
Figure 2
Figure 2. Overlap between differentially expressed CNS genes.
PTZ genes used in this analysis was derived from previously reported microarray data related to seven days of drug treatment. PTZ genes were compared to those in F1 and F2 generations, whereas F1 male genes were compared only to F2. Hypergeometric distribution p values (−log10) are plotted on y-axis. Note significant overlap (≥1.3) in all except F2 female pair-wise comparisons. Differentially expressed genes used in the analysis are listed in Table S1.
Figure 3
Figure 3. Overlap between differentially expressed testis and CNS genes.
PTZ genes used in this analysis was derived from previously reported microarray data related to seven days of drug treatment. PTZ CNS genes were compared to those in PTZ testis (F0) and F1 CNS, whereas F1 testis genes were compared only to F1 CNS. Hypergeometric distribution p values (−log10) are plotted on y-axis. Note significant overlap (≥1.3) between PTZ CNS and F0 testis genes and an overlap between F1 CNS and F1 testis genes with borderline significance (1.24). Differentially expressed genes used in the analysis are listed in Table S1 and S3.
Figure 4
Figure 4. Hierarchical clustering of expression profiles of testis and CNS.
City Block similarity metric and average linkage methods were used for hierarchical clustering of arrays. The cluster was generated using Acuity 4.0 (Molecular Devices). Each time point represents mean of normalized log2 ratio (635/534) of four biological replicates with balanced dye-swaps. PTZ profile shown here was derived from previously reported microarray data related to seven days of drug treatment.
Figure 5
Figure 5. Validation of microarrays using RT-PCR.
Genes were either upregulated (a) or not differentially regulated (b) in F2 male microarrays. Equal amount of F2 male RNA samples from all the four biological replicates used in microarray experiment represented in Figure 1 were pooled together for use in RT-PCR. Fold-change values are plotted on y-axis. Note general downregulation of gene expression in RT-PCR.
Figure 6
Figure 6. Electrophoretic analysis of F2 male CNS total cellular RNA.
Equal amount of F2 male RNA samples from all the four biological replicates used in microarray experiment represented in Figure 1 were pooled together for electrophoretic analysis. Note higher amount of rRNA in experimental flies (a) compared to control (b).

Similar articles

Cited by

References

    1. Li E. Chromatin modification and epigenetic reprogramming in mammalian development. Nat Rev Genet. 2007;3:662–673. - PubMed
    1. Jirtle RL, Skinner MK. Environmental epigenomics and disease susceptibility. Nat Rev Genet. 2007;8:253–262. - PMC - PubMed
    1. Skinner MK, Anway MD, Savenkova MI, Gore AC, Crews D. Transgenerational epigenetic programming of the brain transcriptome and anxiety behavior. PLoS ONE. 2008;3:e3745. - PMC - PubMed
    1. Jiang YH, Bressler J, Beaudet AL. Epigenetics and human disease. Annu Rev Genomics Hum Genet. 2004;5:479–510. - PubMed
    1. Egger G, Liang G, Aparicio A, Jones PA. Epigenetics in human disease and prospects for epigenetic therapy. Nature. 2004;429:457–463. - PubMed

Publication types

Substances