. 2009 May 4:3:7.
doi: 10.3389/neuro.07.007.2009. eCollection 2009.

Directed Interactions Between Auditory and Superior Temporal Cortices and their Role in Sensory Integration

Affiliations

Directed Interactions Between Auditory and Superior Temporal Cortices and their Role in Sensory Integration

Christoph Kayser et al. Front Integr Neurosci. .

Abstract

Recent studies using functional imaging and electrophysiology demonstrate that processes related to sensory integration are not restricted to higher association cortices but already occur in early sensory cortices, such as primary auditory cortex. While anatomical studies suggest the superior temporal sulcus (STS) as likely source of visual input to auditory cortex, little evidence exists to support this notion at the functional level. Here we tested this hypothesis by simultaneously recording from sites in auditory cortex and STS in alert animals stimulated with dynamic naturalistic audio-visual scenes. Using Granger causality and directed transfer functions we first quantified causal interactions at the level of field potentials, and subsequently determined those frequency bands that show effective interactions, i.e. interactions that are relevant for influencing neuronal firing at the target site. We found that effective interactions from auditory cortex to STS prevail below 20 Hz, while interactions from STS to auditory cortex prevail above 20 Hz. In addition, we found that directed interactions from STS to auditory cortex make a significant contribution to multisensory influences in auditory cortex: Sites in auditory cortex showing multisensory enhancement received stronger feed-back from STS during audio-visual than during auditory stimulation, while sites with multisensory suppression received weaker feed-back. These findings suggest that beta frequencies might be important for inter-areal coupling in the temporal lobe and demonstrate that superior temporal regions indeed provide one major source of visual influences to auditory cortex.

Keywords: Granger causality; auto-regressive model; cross-modal; directed transfer function; local field potential; multisensory; superior temporal sulcus.


Figures

Figure 1
Figure 1
Experimental paradigm and multi-unit responses. (A) Auditory, visual or audio–visual stimuli were presented interleaved with baseline intervals and while animals performed a visual fixation task. The right panels display example frames from the stimulus set (left: lion roaring, middle: conspecific animal vocalizing, right: chimps making noises). (B) Neuronal responses were simultaneously recorded in auditory cortex (AC) and the upper bank of the superior temporal sulcus (uSTS) or the STG. Auto-regressive models were fit to these data to obtain measures of directed interactions. The lower-right panel displays the coherence between recordings in AC and STS for the three stimulation conditions (median and 25th and 75th percentile across sites). (C) Distribution of multi-unit (MUA) responses in both regions to the three different conditions. Boxplots indicate the median (middle horizontal line) the 25th and 75th percentile (box) and data range (whiskers). The right panels display the enhancement index for each unit (circle) and the median value across units (bar). The enhancement index characterizes the sign and strength of multisensory interaction and is defined by the comparison of bi-modal and maximal uni-modal responses [AV max(A,V)]. In auditory cortex, most units show a reduced response during audio–visual stimulation, while in the STS most sites show an enhanced response.
Figure 2
Figure 2
Directed interactions. (A) Distribution of Granger causality index across sites for each stimulation condition and both directions of interactions. Boxplots indicate the median (middle horizontal line) the 25th and 75th percentile (box) and data range (whiskers). (B) Directed transfer function for each stimulation condition and both directions of interactions (median and 25th and 75th percentiles). The DTF characterizes the strength of directed interactions in the frequency domain. Orange bars below the frequency axis indicate individual frequency bands used for further analysis. (C) Correlation between the strength of DTF and MUA at the target site. The correlation was computed across all pairs of sites and is show separately for individual frequency bands. Significant correlations are shown in red, insignificant in black. p-values are indicated. Significant correlations indicate that directed interactions in the respective frequency band have a ‘driving’ and influential role for MUA at the target site.
Figure 3
Figure 3
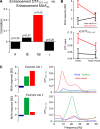
Directed interactions and multisensory influences. (A) Correlation of the multisensory enhancement in feed-back interaction from STS to auditory cortex and in MUA activity in auditory cortex. The correlation was computed based on the enhancement index applied to the DTF and multi-unit activity and across all pairs of sites. Significant correlations are shown in red, insignificant in black. p-values are indicated. Significant correlations indicate that enhanced (reduced) MUA in the audio–visual condition co-occurs with enhanced (reduced) feed-back from STS. (B) Displays the average DTF (low beta band) from STS to auditory cortex and MUA in auditory cortex separately for sites where the MUA shows multisensory enhancement (black) or suppression (red). (C) Example data showing the MUA and DTF for two pairs of sites. In the upper example the MUA activity is enhanced, in the lower it is reduced.

References

    1. Abeles M., Prut Y., Bergman H., Vaadia E. (1994). Synchronization in neuronal transmission and its importance for information processing. Prog. Brain Res. 102, 395–40410.1016/S0079-6123(08)60555-5 - DOI - PubMed
    1. Akaike H. (1974). A new look at the statistical model identification. IEEE Trans. Automat. Contr. 19, 716–72310.1109/TAC.1974.1100705 - DOI
    1. Baccala L. A., Sameshima K. (2001). Partial directed coherence: a new concept in neural structure determination. Biol. Cybern. 84, 463–47410.1007/PL00007990 - DOI - PubMed
    1. Barraclough N. E., Xiao D., Baker C. I., Oram M. W., Perrett D. I. (2005). Integration of visual and auditory information by superior temporal sulcus neurons responsive to the sight of actions. J. Cogn. Neurosci. 17, 377–39110.1162/0898929053279586 - DOI - PubMed
    1. Benevento L. A., Fallon J., Davis B. J., Rezak M. (1977). Auditory–visual interaction in single cells in the cortex of the superior temporal sulcus and the orbital frontal cortex of the macaque monkey. Exp. Neurol. 57, 849–87210.1016/0014-4886(77)90112-1 - DOI - PubMed

LinkOut - more resources