. 2009 Jun 5;4(6):e5806.
doi: 10.1371/journal.pone.0005806.

Azithromycin treatment alters gene expression in inflammatory, lipid metabolism, and cell cycle pathways in well-differentiated human airway epithelia

Affiliations

Azithromycin treatment alters gene expression in inflammatory, lipid metabolism, and cell cycle pathways in well-differentiated human airway epithelia

Carla Maria P Ribeiro et al. PLoS One. .

Abstract

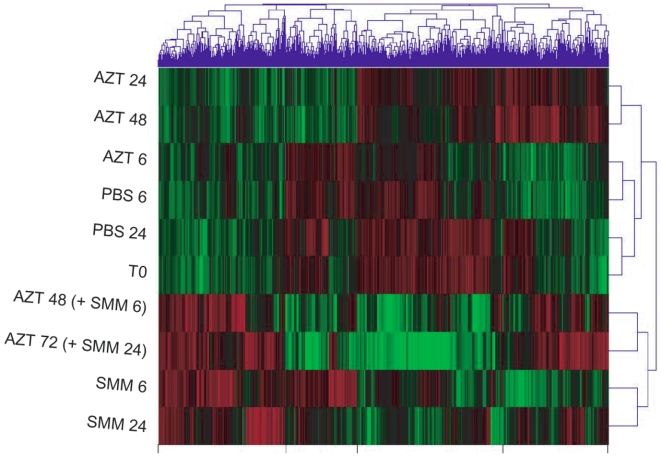
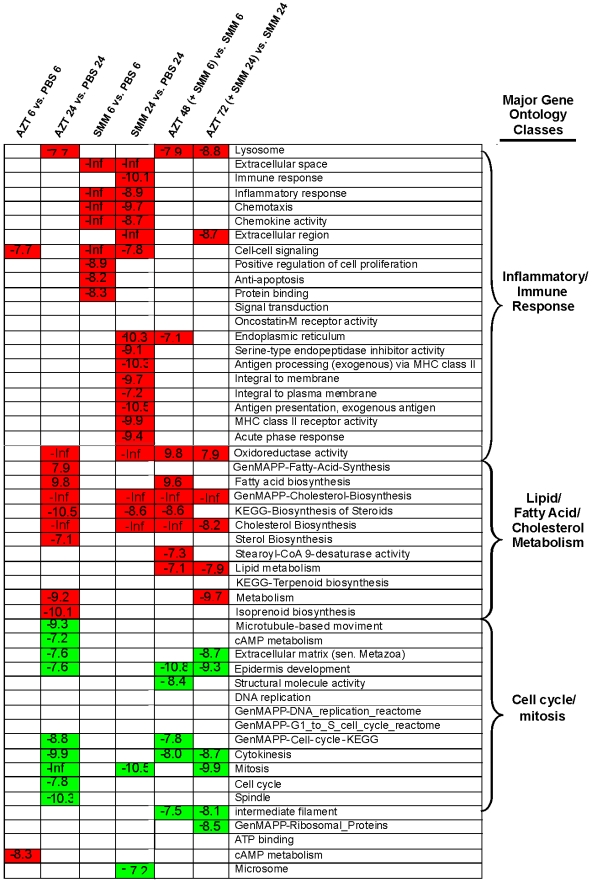
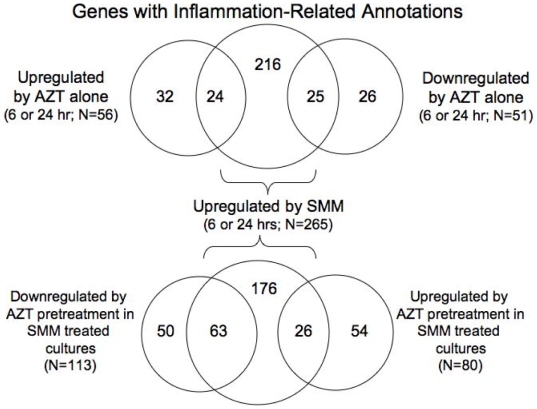
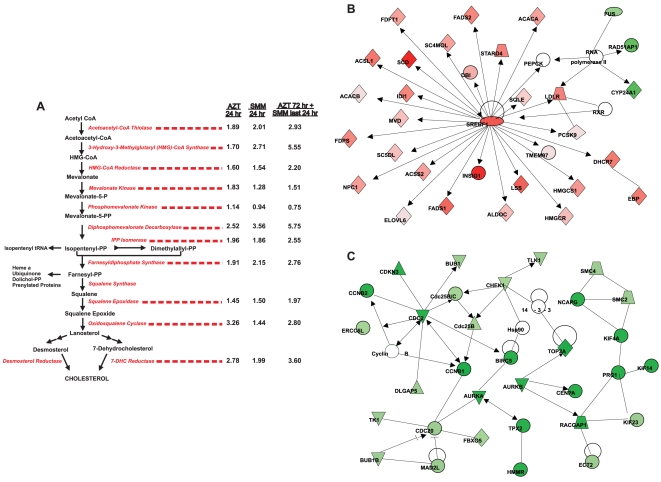
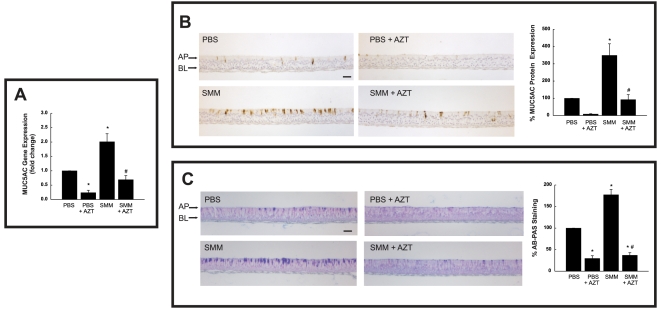
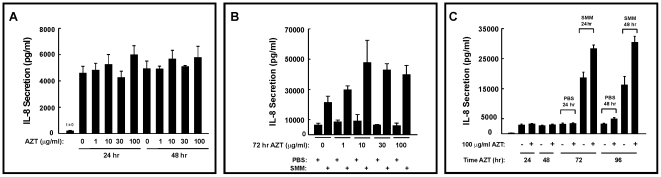
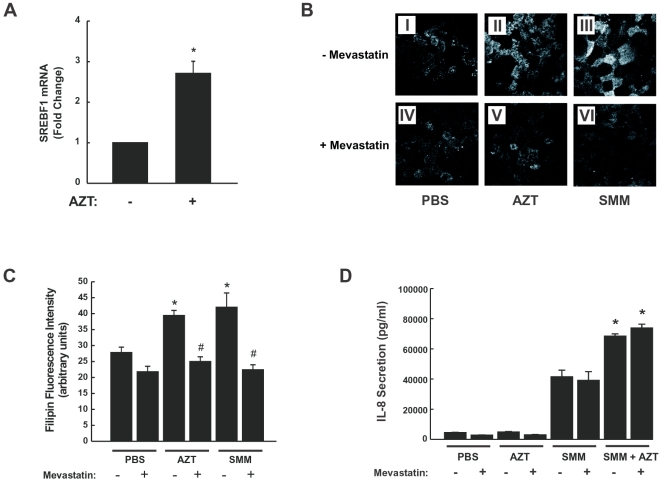
Prolonged macrolide antibiotic therapy at low doses improves clinical outcome in patients affected with diffuse panbronchiolitis and cystic fibrosis. Consensus is building that the therapeutic effects are due to anti-inflammatory, rather than anti-microbial activities, but the mode of action is likely complex. To gain insights into how the macrolide azithromycin (AZT) modulates inflammatory responses in airways, well-differentiated primary cultures of human airway epithelia were exposed to AZT alone, an inflammatory stimulus consisting of soluble factors from cystic fibrosis airways, or AZT followed by the inflammatory stimulus. RNA microarrays were conducted to identify global and specific gene expression changes. Analysis of gene expression changes revealed that the AZT treatment alone altered the gene profile of the cells, primarily by significantly increasing the expression of lipid/cholesterol genes and decreasing the expression of cell cycle/mitosis genes. The increase in cholesterol biosynthetic genes was confirmed by increased filipin staining, an index of free cholesterol, after AZT treatment. AZT also affected genes with inflammatory annotations, but the effect was variable (both up- and down-regulation) and gene specific. AZT pretreatment prevented the up-regulation of some genes, such as MUC5AC and MMP9, triggered by the inflammatory stimulus, but the up-regulation of other inflammatory genes, e.g., cytokines and chemokines, such as interleukin-8, was not affected. On the other hand, HLA genes were increased by AZT. Notably, secreted IL-8 protein levels did not reflect mRNA levels, and were, in fact, higher after AZT pretreatment in cultures exposed to the inflammatory stimulus, suggesting that AZT can affect inflammatory pathways other than by altering gene expression. These findings suggest that the specific effects of AZT on inflamed and non-inflamed airway epithelia are likely relevant to its clinical activity, and their apparent complexity may help explain the diverse immunomodulatory roles of macrolides.


Conflict of interest statement

Competing Interests: The authors have declared that no competing interests exist.

Figures

Figure 1
Figure 1. Clustering of the expression data.
Clustering of the data, as described in Methods, revealing the general organization of differential gene expression. Green color represents reduced gene expression relative to red color, which represents increased expression. Treatments are explained in Table 1. PBS: phosphate buffered saline. AZT: azithromycin. SMM: Supernatant of mucopurulent material from CF airways.
Figure 2
Figure 2. Illustration of the most significant gene ontology (GO) groups whose expression was modulated by the various treatments.
The following comparisons were analyzed: AZT 6 hr vs. PBS 6 hr, AZT 24 hr vs. PBS 24 hr, SMM 6 hr vs. PBS 6 hr, SMM 24 hr vs. PBS 24 hr, AZT 48 hr (+SMM during last 6 hr) vs. SMM 6 hr, and AZT 72 hr (+SMM during the last 24 hr) vs. SMM 24 hr. Green = down-regulated groups; red = up-regulated groups; white = not significant. Values in boxes represent the probability that the genes within the list from each GO group would be present by chance – the more negative, the less likely genes within these categories are present by chance. See corresponding text for details.
Figure 3
Figure 3. Venn diagrams representing the number of differentially expressed inflammation-related genes as a function of treatment.
The top Venn diagram compares SMM-induced genes to AZT up- and down-regulated genes. The bottom Venn diagram shows how AZT pretreatment affected SMM genes.
Figure 4
Figure 4. AZT up-regulates lipid/cholesterol metabolism and down-regulates cell cycle genes.
A: The cholesterol biosynthetic pathway and the fold-changes induced for each of the enzymes within the pathway are indicated. Data are expressed as fold changes in gene expression values from 24 hr AZT vs. 24 hr PBS (left numbers), 24 hr SMM vs. 24 hr PBS (center numbers) and 72 hr AZT (+addition of mucosal SMM during the last 24 hr) vs. 24 hr PBS (right numbers). Both SMM and AZT increased the enzymes involved in the cholesterol biosynthetic pathway, and their effect appears to be additive. B and C: Ingenuity Pathways Analysis™ was used to generate two top significant networks for genes regulated by AZT 24 hr vs. PBS 24 hr. The top two networks are shown. The analysis settings were as follows: only direct relationships were considered, endogenous chemicals were excluded, and only relationships where data sources = Argonaute 2 or Ingenuity curated findings were considered. The network depicted in B was labeled “Lipid Metabolism, Small Molecule Biochemistry, Nucleic Acid Metabolism” and had a score = 47. The network depicted in C was labeled “Cancer, Cell Cycle, Reproductive System Disease” and had a score = 44. Red indicates up-regulation. Green indicates down-regulation.
Figure 5
Figure 5. AZT decreases basal and SMM-stimulated mRNA and protein expression levels of MUC5AC in human airway epithelia.
Well-differentiated HBE were exposed for 24 hr to mucosal PBS or mucosal SMM in the absence of presence of 72 hr pretreatment with 30 µg/ml serosal AZT. A: MUC5AC mRNA levels, expressed as fold change from mucosal PBS-exposed HBE. B: Immunocytochemical assessment of MUC5AC in HBE. Right panel depicts compiled data from MUC5AC expression as a percent of PBS-exposed HBE. C: AB-PAS staining from HBE subjected to the various treatments. Right panel shows compiled data from AB-PAS staining as a percent of PBS-exposed HBE. *p<0.05 vs. PBS-exposed HBE; # p<0.05 SMM+AZT-exposed HBE vs. SMM-exposed HBE.
Figure 6
Figure 6. Effect of AZT on IL-8 secretion in human airway epithelia.
A: AZT does not affect basal airway epithelial IL-8 secretion. Basal IL-8 secretion from well-differentiated primary cultures of normal human bronchial epithelia serosally exposed to different doses of AZT for 24 hr and 48 hr. B: Dose response for AZT-potentiated IL-8 secretion triggered by 24 hr mucosal exposure of HBE to supernatant from mucopurulent material (SMM) from CF airways. Well-differentiated primary cultures of normal human bronchial epithelia were pretreated with AZT for 72 hr and exposed to mucosal PBS or SMM during the last 24 hr of macrolide treatment. C: Time course for AZT-potentiated SMM-induced IL-8 secretion. Vehicle or 100 µg/ml AZT were added to the serosal surface of well-differentiated normal HBE and a 48 hr time course performed for IL-8 secretion. AZT pretreatment did not alter the basal levels of secreted IL-8, but potentiated SMM-induced IL-8 secretion at both 24 and 48 hr (corresponding to 72 and 96 hr AZT treatment, respectively).
Figure 7
Figure 7. Mucosal bacterial and inflammatory mediator challenge (SMM) or serosal AZT induces accumulation of cholesterol in human airway epithelia.
A: Quantitative RT-PCR confirmation of increased SREBP1 levels in AZT-treated cultures. B: Representative filipin stain in WD HBE exposed to 24 hr mucosal PBS (I), 24 hr mucosal SMM (II) or 24 hr 30 µg/ml serosal AZT (III). (IV–VI): Same conditions as in I–III, except that cultures were pretreated with 50 µM mevastatin, as described in Methods. Bar: 10 µm. C: Compiled data from filipin fluorescence from the treatments illustrated in 7B. *p<0.05 vs. 24 hr PBS-exposed HBE; # p<0.05 vs. same condition without mevastatin pretreatment. D: IL-8 secretion induced by SMM or by SMM in presence of AZT is not affected by inhibition of cholesterol biosynthesis. Well-differentiated HBE were exposed for 24 hr to mucosal PBS, mucosal SMM or 30 µg/ml serosal AZT in the presence or absence of mevastatin, and IL-8 secretory responses measured as described in Methods. *p<0.05 SMM+AZT- vs. SMM-exposed HBE.

References

    1. Jaffe A, Bush A. Anti-inflammatory effects of macrolides in lung disease. Pediatr Pulmonol. 2001;31:464–473. - PubMed
    1. Pechere JC. New perspectives on macrolide antibiotics. Int J Antimicrob Agents. 2001;18(Suppl 1):S93–S97. - PubMed
    1. Shinkai M, Henke MO, Rubin BK. Macrolide antibiotics as immunomodulatory medications: proposed mechanisms of action. Pharmacol Ther. 2008;117:393–405. - PubMed
    1. Wagner T, Soong G, Sokol S, Saiman L, Prince A. Effects of azithromycin on clinical isolates of Pseudomonas aeruginosa from cystic fibrosis patients. Chest. 2005;128:912–919. - PubMed
    1. Hoffmann N, Lee B, Hentzer M, Rasmussen TB, Song Z, et al. Azithromycin blocks quorum sensing and alginate polymer formation and increases the sensitivity to serum and stationary-growth-phase killing of Pseudomonas aeruginosa and attenuates chronic P. aeruginosa lung infection in Cftr(-/-) mice. Antimicrob Agents Chemother. 2007;51:3677–3687. - PMC - PubMed

Publication types

MeSH terms