

Estimation of fine-scale recombination intensity variation in the white-echinus interval of D. melanogaster
- PMID: 19504037
- PMCID: PMC2748731
- DOI: 10.1007/s00239-009-9250-5
Estimation of fine-scale recombination intensity variation in the white-echinus interval of D. melanogaster
Abstract
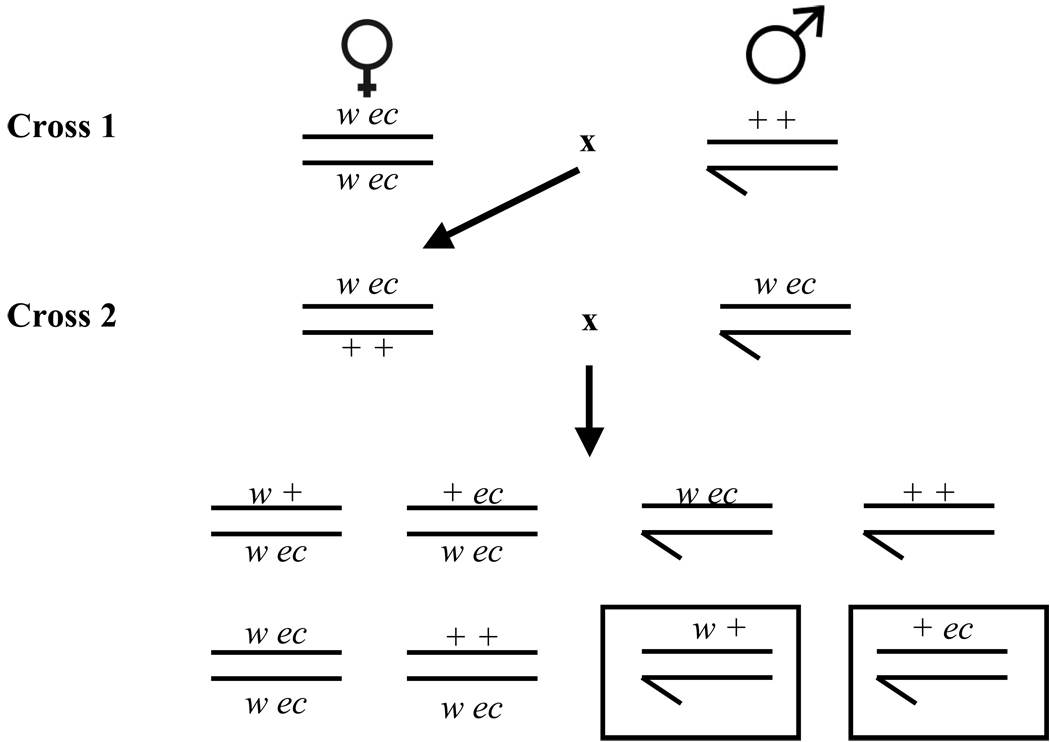
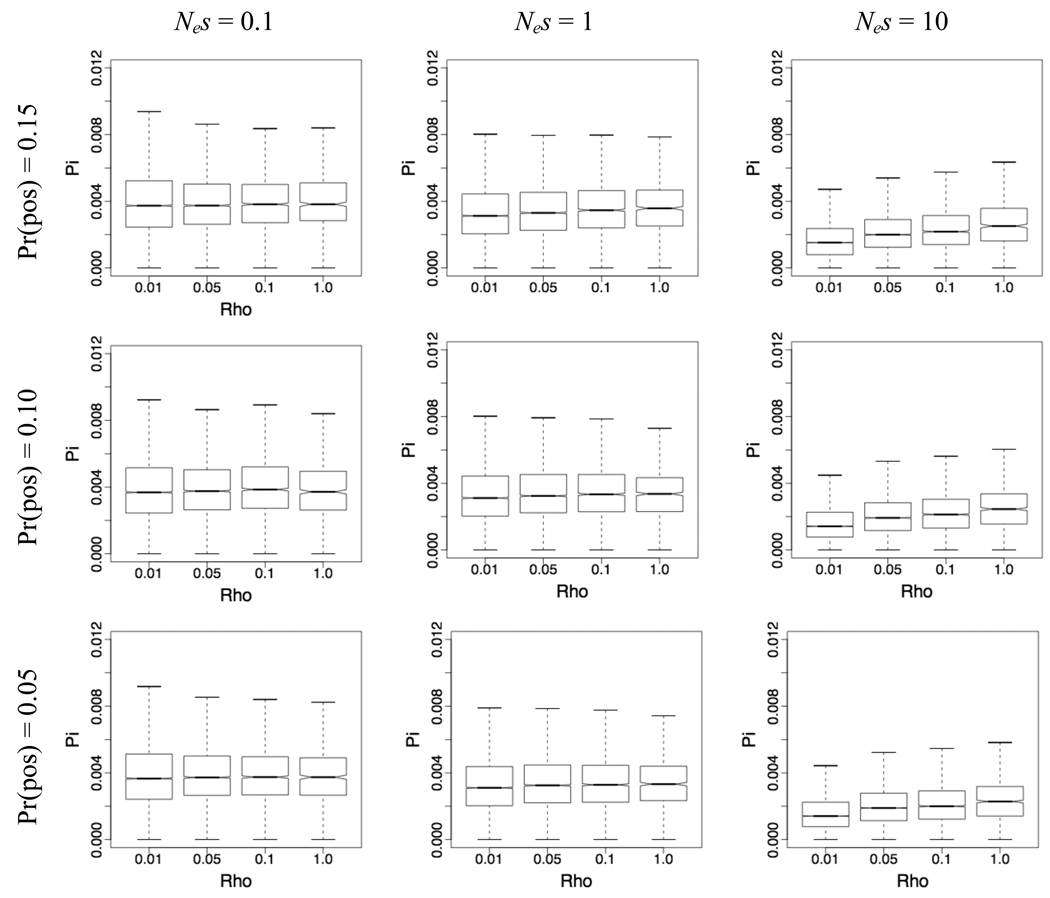
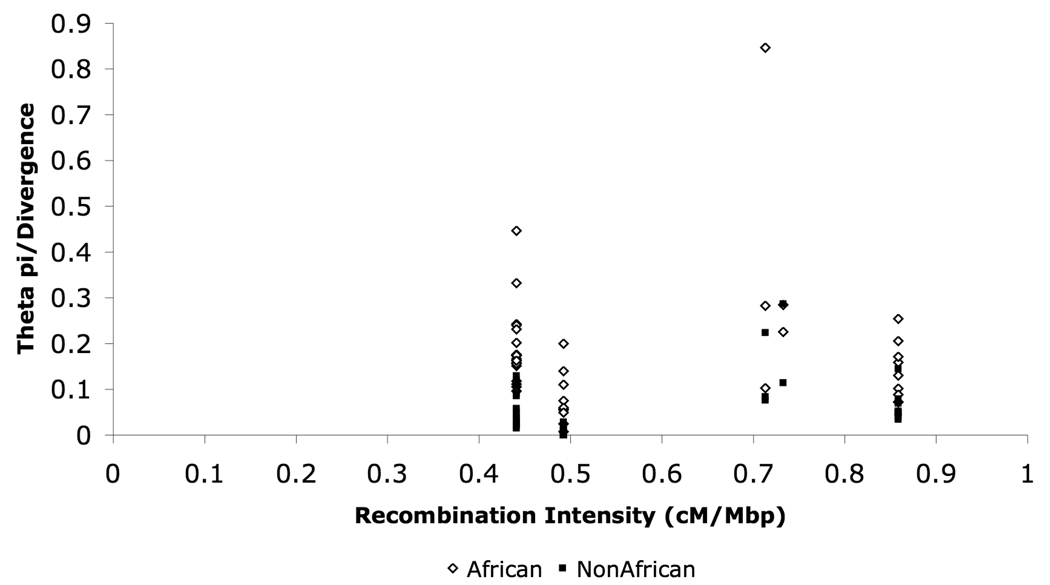
Accurate assessment of local recombination rate variation is crucial for understanding the recombination process and for determining the impact of natural selection on linked sites. In Drosophila, local recombination intensity has been estimated primarily by statistical approaches, by estimating the local slope of the relationship between the physical and genetic maps. However, these estimates are limited in resolution and, as a result, the physical scale at which recombination intensity varies in Drosophila is largely unknown. Although there is some evidence suggesting as much as a 40-fold variation in crossover rate at a local scale in D. pseudoobscura, little is known about the fine-scale structure of recombination rate variation in D. melanogaster. Here we experimentally examine the fine-scale distribution of crossover events in a 1.2-Mb region on the D. melanogaster X chromosome using a classic genetic mapping approach. Our results show that crossover frequency is significantly heterogeneous within this region, varying approximately 3.5-fold. Simulations suggest that this degree of heterogeneity is sufficient to affect levels of standing nucleotide diversity, although the magnitude of this effect is small. We recover no statistical association between empirical estimates of nucleotide diversity and recombination intensity, which is likely due to the limited number of loci sampled in our population genetic data set. However, codon bias is significantly negatively correlated with fine-scale recombination intensity estimates, as expected. Our results shed light on the relevant physical scale to consider in evolutionary analyses relating to recombination rate and highlight the motivations to increase the resolution of the recombination map in Drosophila.
Figures


Similar articles
-
Recombination rate plasticity: revealing mechanisms by design.Philos Trans R Soc Lond B Biol Sci. 2017 Dec 19;372(1736):20160459. doi: 10.1098/rstb.2016.0459. Philos Trans R Soc Lond B Biol Sci. 2017. PMID: 29109222 Free PMC article. Review.
-
Fine-scale mapping of recombination rate in Drosophila refines its correlation to diversity and divergence.Proc Natl Acad Sci U S A. 2008 Jul 22;105(29):10051-6. doi: 10.1073/pnas.0801848105. Epub 2008 Jul 11. Proc Natl Acad Sci U S A. 2008. PMID: 18621713 Free PMC article.
-
Genome-wide fine-scale recombination rate variation in Drosophila melanogaster.PLoS Genet. 2012;8(12):e1003090. doi: 10.1371/journal.pgen.1003090. Epub 2012 Dec 20. PLoS Genet. 2012. PMID: 23284288 Free PMC article.
-
Fine-scale heterogeneity in crossover rate in the garnet-scalloped region of the Drosophila melanogaster X chromosome.Genetics. 2013 Jun;194(2):375-87. doi: 10.1534/genetics.112.146746. Epub 2013 Feb 14. Genetics. 2013. PMID: 23410829 Free PMC article.
-
Mutation pressure, natural selection, and the evolution of base composition in Drosophila.Genetica. 1998;102-103(1-6):49-60. Genetica. 1998. PMID: 9720271 Review.
Cited by
-
The many landscapes of recombination in Drosophila melanogaster.PLoS Genet. 2012;8(10):e1002905. doi: 10.1371/journal.pgen.1002905. Epub 2012 Oct 11. PLoS Genet. 2012. PMID: 23071443 Free PMC article.
-
Intronic AT skew is a defendable proxy for germline transcription but does not predict crossing-over or protein evolution rates in Drosophila melanogaster.J Mol Evol. 2010 Dec;71(5-6):415-26. doi: 10.1007/s00239-010-9395-2. Epub 2010 Oct 12. J Mol Evol. 2010. PMID: 20938653
-
Genetic linkage and natural selection.Philos Trans R Soc Lond B Biol Sci. 2010 Aug 27;365(1552):2559-69. doi: 10.1098/rstb.2010.0106. Philos Trans R Soc Lond B Biol Sci. 2010. PMID: 20643746 Free PMC article.
-
High-resolution linkage map for two honeybee chromosomes: the hotspot quest.Mol Genet Genomics. 2014 Feb;289(1):11-24. doi: 10.1007/s00438-013-0784-2. Epub 2013 Oct 27. Mol Genet Genomics. 2014. PMID: 24162559
-
Recombination rate plasticity: revealing mechanisms by design.Philos Trans R Soc Lond B Biol Sci. 2017 Dec 19;372(1736):20160459. doi: 10.1098/rstb.2016.0459. Philos Trans R Soc Lond B Biol Sci. 2017. PMID: 29109222 Free PMC article. Review.
References
-
- Ashburner M. Drosophila: A Laboratory handbook. Cold Spring Harbor: Cold Spring Harbor Laboratory Press; 1989.
-
- Begun DJ, Aquadro CF. Levels of naturally occurring DNA polymorphism correlate with recombination rates in Drosophila melanogaster. Nature (London) 1992;356:519–520. - PubMed
Publication types
MeSH terms
Grants and funding
LinkOut - more resources
Full Text Sources
Molecular Biology Databases
Miscellaneous
