

Parametric exploration of the liver by magnetic resonance methods
- PMID: 19504103
- PMCID: PMC2762052
- DOI: 10.1007/s00330-009-1470-y
Parametric exploration of the liver by magnetic resonance methods
Abstract
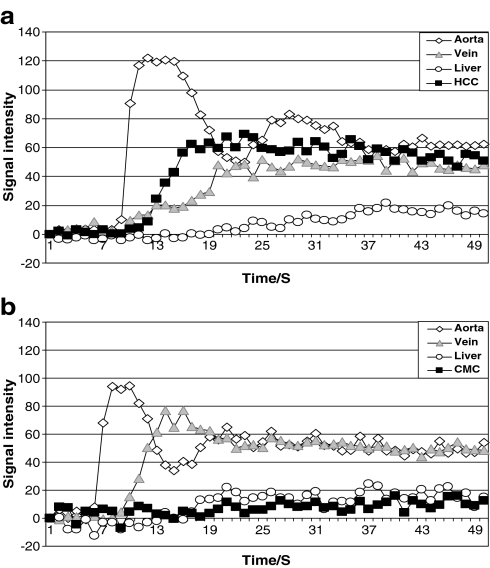
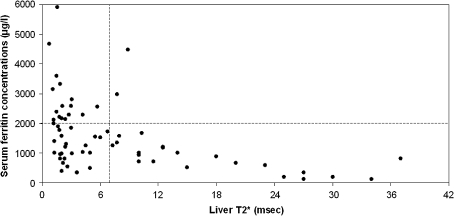
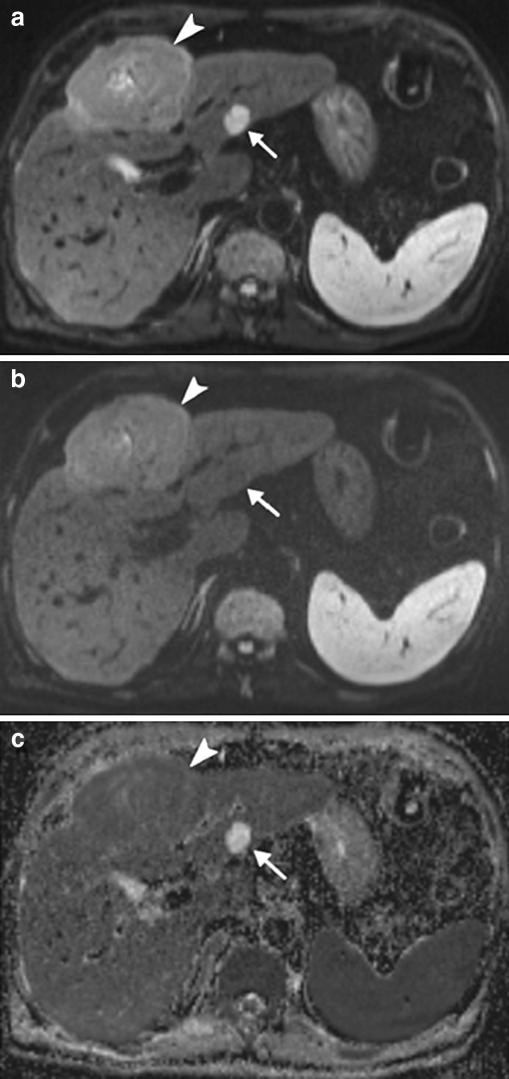
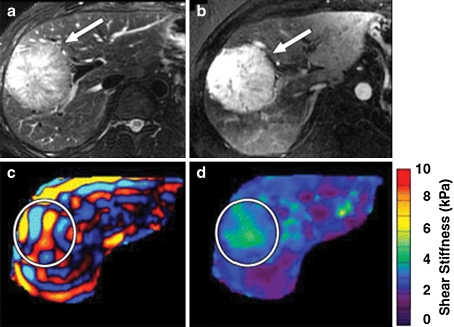
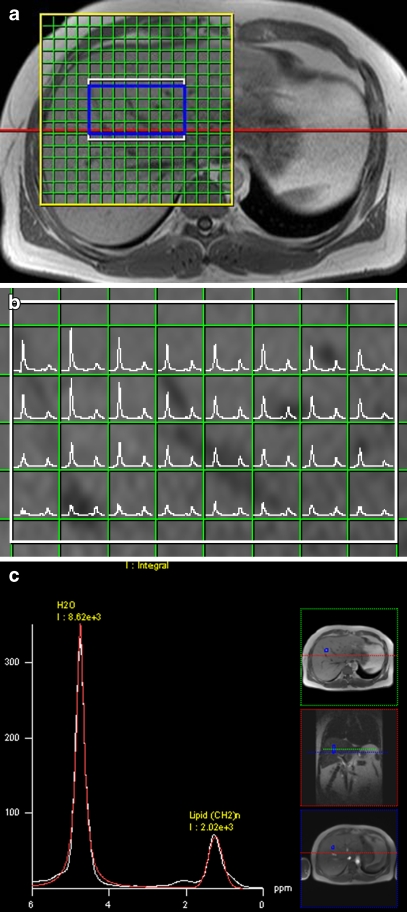
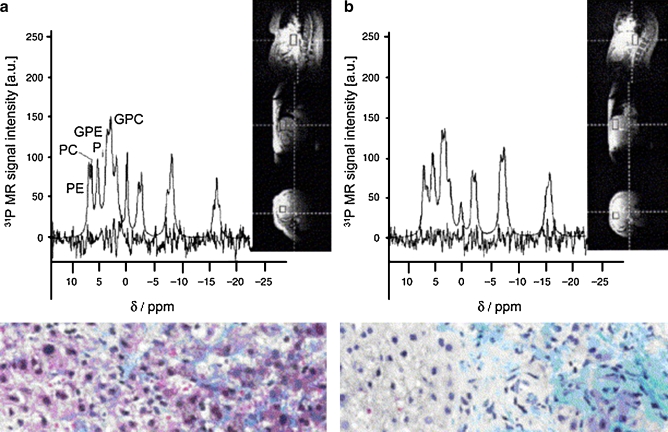
MRI, as a completely noninvasive technique, can provide quantitative assessment of perfusion, diffusion, viscoelasticity and metabolism, yielding diverse information about liver function. Furthermore, pathological accumulations of iron and lipids can be quantified. Perfusion MRI with various contrast agents is commonly used for the detection and characterization of focal liver disease and the quantification of blood flow parameters. An extended new application is the evaluation of the therapeutic effect of antiangiogenic drugs on liver tumours. Novel, but already widespread, is a histologically validated relaxometry method using five gradient echo sequences for quantifying liver iron content elevation, a measure of inflammation, liver disease and cancer. Because of the high perfusion fraction in the liver, the apparent diffusion coefficients strongly depend on the gradient factors used in diffusion-weighted MRI. While complicating analysis, this offers the opportunity to study perfusion without contrast injection. Another novel method, MR elastography, has already been established as the only technique able to stage fibrosis or diagnose mild disease. Liver fat content is accurately determined with multivoxel MR spectroscopy (MRS) or by faster MRI methods that are, despite their widespread use, prone to systematic error. Focal liver disease characterisation will be of great benefit once multivoxel methods with fat suppression are implemented in proton MRS, in particular on high-field MR systems providing gains in signal-to-noise ratio and spectral resolution.
Figures
Similar articles
-
Liver fibrosis: Review of current imaging and MRI quantification techniques.J Magn Reson Imaging. 2017 May;45(5):1276-1295. doi: 10.1002/jmri.25550. Epub 2016 Dec 16. J Magn Reson Imaging. 2017. PMID: 27981751 Review.
-
Liver Fibrosis Quantification by Magnetic Resonance Imaging.Top Magn Reson Imaging. 2017 Dec;26(6):229-241. doi: 10.1097/RMR.0000000000000149. Top Magn Reson Imaging. 2017. PMID: 28858038 Free PMC article. Review.
-
Updates on Quantitative MRI of Diffuse Liver Disease: A Narrative Review.Biomed Res Int. 2022 Dec 28;2022:1147111. doi: 10.1155/2022/1147111. eCollection 2022. Biomed Res Int. 2022. PMID: 36619303 Free PMC article. Review.
-
New imaging techniques for liver diseases.J Hepatol. 2015 Mar;62(3):690-700. doi: 10.1016/j.jhep.2014.10.014. Epub 2014 Oct 17. J Hepatol. 2015. PMID: 25457198 Review.
-
Prospective Evaluation of Virtual MR Elastography With Diffusion-Weighted Imaging in Subjects With Nonalcoholic Fatty Liver Disease.J Magn Reson Imaging. 2022 Nov;56(5):1448-1456. doi: 10.1002/jmri.28154. Epub 2022 Mar 14. J Magn Reson Imaging. 2022. PMID: 35285996
Cited by
-
Evaluation of liver fibrosis with a monoexponential model of intravoxel incoherent motion magnetic resonance imaging.Oncotarget. 2018 May 15;9(37):24619-24626. doi: 10.18632/oncotarget.24758. eCollection 2018 May 15. Oncotarget. 2018. PMID: 29872492 Free PMC article.
-
Assessment of relevant hepatic steatosis in obese adolescents by rapid fat-selective GRE imaging with spatial-spectral excitation: a quantitative comparison with spectroscopic findings.Eur Radiol. 2011 Apr;21(4):816-22. doi: 10.1007/s00330-010-1975-4. Epub 2010 Oct 3. Eur Radiol. 2011. PMID: 20890760
-
Magnetic resonance spectroscopy to study hepatic metabolism in diffuse liver diseases, diabetes and cancer.World J Gastroenterol. 2010 Apr 7;16(13):1577-86. doi: 10.3748/wjg.v16.i13.1577. World J Gastroenterol. 2010. PMID: 20355236 Free PMC article. Review.
-
3.0 T proton magnetic resonance spectroscopy of the liver: quantification of choline.World J Gastroenterol. 2013 Mar 7;19(9):1472-7. doi: 10.3748/wjg.v19.i9.1472. World J Gastroenterol. 2013. PMID: 23539666 Free PMC article.
-
Protective Effect of Yang Mi Ryung® Extract on Noise-Induced Hearing Loss in Mice.Evid Based Complement Alternat Med. 2017;2017:9814836. doi: 10.1155/2017/9814836. Epub 2017 Nov 15. Evid Based Complement Alternat Med. 2017. PMID: 29270205 Free PMC article.
References
-
- Lupescu IG, Grasu M, Capşa R, Pitrop A, Georgescu SA. Hepatic perfusion disorders: computer-tomographic and magnetic resonance imaging. J Gastrointestin Liver Dis. 2006;15:273–279. - PubMed
-
- Karabulut N, Elmas N. Contrast agents used in MR imaging of the liver. Diagn Interv Radiol. 2006;12:22–30. - PubMed
-
- Abdullah SS, Pialat JB, Wiart M, Duboeuf F, Mabrut J-Y, Bancel B, Rode A, Ducerf C, Baulieux J, Berthezene Y. Characterization of hepatocellular carcinoma and colorectal liver metastasis by means of perfusion MRI. J Magn Reson Imaging. 2008;28:390–395. - PubMed
-
- Miyazaki K, Collins DJ, Walker-Samuel S, Taylor JN, Padhani AR, Leach MO, Koh D-M. Quantitative mapping of hepatic perfusion index using MR imaging: a potential reproducible tool for assessing tumour response to treatment with the antiangiogenic compound BIBF 1120, a potent triple angiokinase inhibitor. Eur Radiol. 2008;18:1414–1421. - PubMed
MeSH terms
Substances
LinkOut - more resources
Full Text Sources
Medical
