. 2009 Jul 6;206(7):1473-83.
doi: 10.1084/jem.20082842. Epub 2009 Jun 8.

Agricultural pesticide exposure and the molecular connection to lymphomagenesis

Affiliations

Agricultural pesticide exposure and the molecular connection to lymphomagenesis

Julie Agopian et al. J Exp Med. .

Abstract

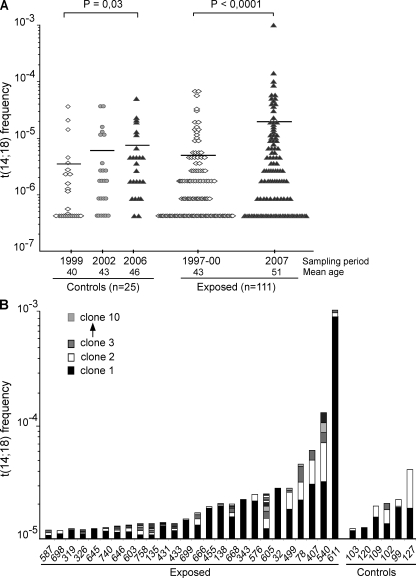
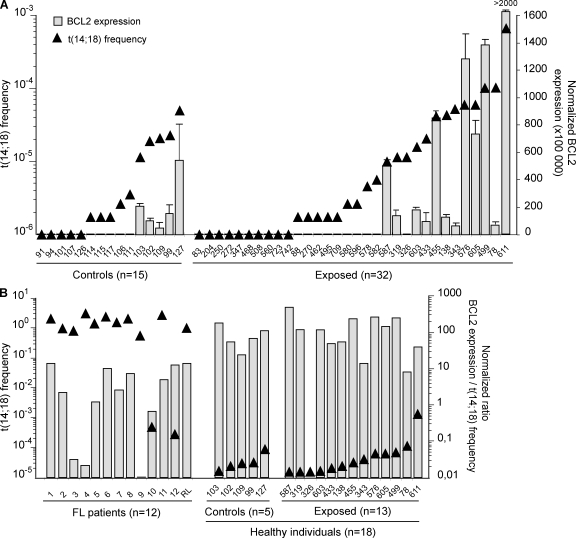
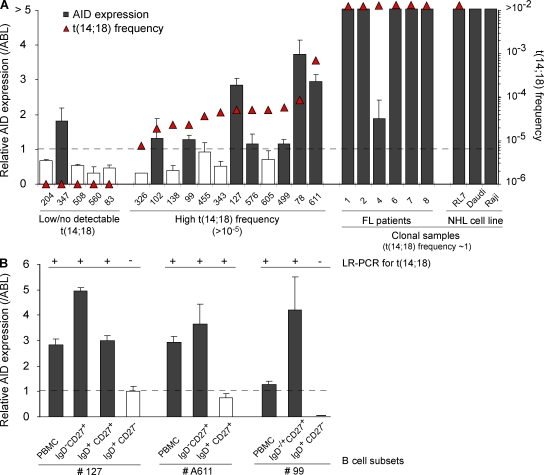
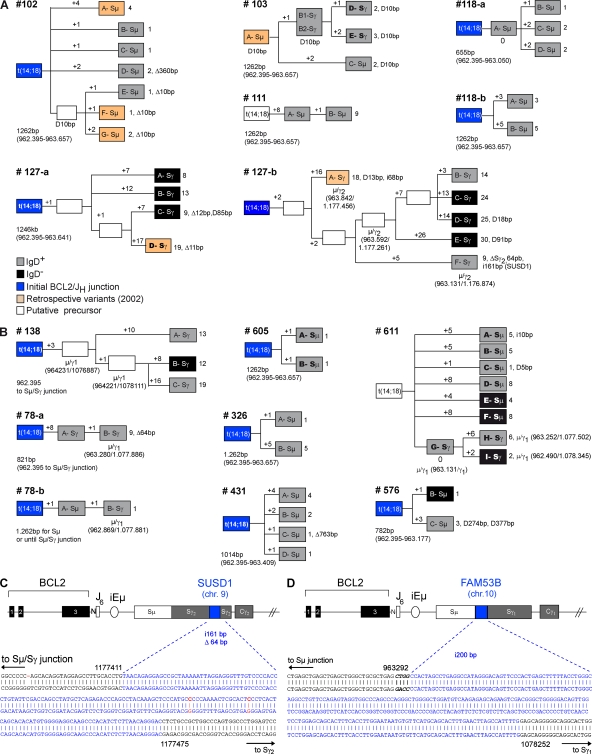
The t(14;18) translocation constitutes the initiating event of a causative cascade leading to follicular lymphoma (FL). t(14;18) translocations are present in blood from healthy individuals, but there is a trend of increased prevalence in farmers exposed to pesticides, a group recently associated with higher risk of t(14;18)(+) non-Hodgkin's lymphoma development. A direct connection between agricultural pesticide use, t(14;18) in blood, and malignant progression, however, has not yet been demonstrated. We followed t(14;18) clonal evolution over 9 yr in a cohort of farmers exposed to pesticides. We show that exposed individuals bear particularly high t(14;18) frequencies in blood because of a dramatic clonal expansion of activated t(14;18)(+) B cells. We further demonstrate that such t(14;18)(+) clones recapitulate the hallmark features of developmentally blocked FL cells, with some displaying aberrant activation-induced cytidine deaminase activity linked to malignant progression. Collectively, our data establish that expanded t(14;18)(+) clones constitute bona fide precursors at various stages of FL development, and provide a molecular connection between agricultural pesticide exposure, t(14;18) frequency in blood, and clonal progression.


Figures

Figure 1.
Figure 1.
Agricultural exposure drives a dramatic increase of t(14;18)+ clones in blood. (A) Evolution of t(14;18) frequency in PBMCs from control and exposed populations over time. The mean age at enrollment was 40 yr (±9 yr) for the controls and 43 yr (±9 yr) for the exposed individuals, with an average follow-up time of 7 and 9 yr, respectively. t(14;18) frequency was assessed at each time point by fluctuation SR-PCR. Horizontal lines indicate mean frequencies. p-values were calculated using the Mann-Whitney test. (B) Clonality analysis. Exposed (n = 26/51, 51%) and control (n = 6/46, 13%) samples with a high t(14;18) frequency (>10−5) in the last sampling period are shown and ordered according to increasing t(14;18) frequencies (the total number of clones in each individual for which more than one positive amplicon was found is summarized in Table S1). BCL2/JH breakpoints (Table I and unpublished data) were identified by the cloning/sequencing of SR-PCR products (n ≈ 1,000) amplified from PBMCs, and were used to monitor the extent of polyclonality within t(14;18)+ cells in each individual. For each individual, independent BCL2/JH clones are pictured in distinct shades and are represented from bottom to top according to increasing frequency.
Figure 2.
Figure 2.
t(14;18)+ cells in HI are actively transcribing BCL2 from the translocated allele. (A) Superposition of t(14;18) frequency (triangles; left y axis) and the relative BCL2/JH expression levels (histograms; right y axis) in PBMC samples from controls (n = 15) and exposed individuals (n = 32) evaluated by real-time quantitative PCR. The absolute BCL2/JH expression data were normalized to ABL, and the value is arbitrarily set as ×100,000. Each bar represents the mean of replicate wells. The results shown were obtained from two independent PCRs performed in duplicate (B) BCL2/JH expression levels in FL biopsies (n = 12) compared with samples from HI (n = 18) with respect to their t(14;18) frequency. A normalized ratio of BCL2 expression per t(14;18)+ cell was calculated by dividing the normalized BCL2/JH transcription level of a given sample by the corresponding t(14;18) frequency (as determined by real-time PCR).
Figure 3.
Figure 3.
AID expression correlates with increasing t(14;18) frequencies in HI. (A) Superposition of t(14;18) frequency (triangles; left y axis) and the relative AID expression levels (histograms; right y axis) in PBMC samples from HI (n = 18), FL patient samples (n = 6), and lymphoma cell lines (RL7, FL; Daudi and Raji, Burkitt lymphoma) evaluated by real-time quantitative PCR. The expression data were normalized to ABL. As AID expression is assumed to be low/negative in naive cells, RT-PCR data are represented relative to the levels obtained in the sorted naive (CD19+CD27IgD+) B cell fraction and are considered positive (shaded histograms) above this arbitrary threshold of 1 (dashed line). The results shown were obtained from two independent PCRs performed in duplicate (except for clonal FL samples). (B) AID expression is enriched in t(14;18)+ fractions. Comparison of t(14;18) detection (+/−, as determined by LR-PCR) and AID expression levels (shaded histograms) in isolated B cell subsets (based on CD27 and IgD markers) from two HI. The results shown were obtained from one PCR performed in duplicate (except for PBMC samples analyzed two times in duplicate). Data were normalized as in Fig. 3 A.
Figure 4.
Figure 4.
AID mediates the evolution of t(14;18)+ activated clones in HI. (A and B) Genealogic trees generated from healthy controls (n = 5) and exposed individuals (n = 7) for which several molecular subclones derived from the same BCL2/JH junction (labeled A to G in boxes) were obtained. Trees are organized based on ICV, including SHM in the Sµ region and CSR on both the expressed (gray boxes, sIgD+; black boxes, sIgD) and the translocated (indicated as Sµ or Sγ in boxes) alleles. For most trees, the BCL2/JH junction was already identified at enrollment (blue boxes, ICV information not available). Six LR-PCR amplicons were obtained from the retrospective PBMC samples (orange boxes) and could be branched in four distinct trees. Stepwise accumulation of mutations is indicated by numbers above the branches (+1 to +26). Total mutations, insertions (i), duplications (D), and deletions (▵) are summarized at the end of each branch. Shared mutations were used to define putative intermediate or precursor cells (open boxes). The length of the analyzed Sµ region is indicated below each tree and varied slightly in case of CSR. (C) Sequence analysis of an AID-mediated foreign DNA insertion (200 bp from the FAM53B gene, chr 10, in blue) into an Sµ/Sγ switch junction of an activated t(14;18)+ clone from sample #138. (D) Sequence analysis of a foreign DNA insertion (161 bp from the SUSD1 gene, chr 9, in blue) into an intra-Sγ2 deletion (▵64 bp) from an activated t(14;18)+ clone from sample #127-b (see clone F-Sγ in A). Numbers refer to germline IGH available from GenBank/EMBL/DDBJ under accession no. NG_001019.

References

    1. Aarts W.M., Bende R.J., Steenbergen E.J., Kluin P.M., Ooms E.C., Pals S.T., van Noesel C.J. 2000. Variable heavy chain gene analysis of follicular lymphomas: correlation between heavy chain isotype expression and somatic mutation load.Blood. 95:2922–2929 - PubMed
    1. Bende R.J., Smit L.A., van Noesel C.J. 2007. Molecular pathways in follicular lymphoma.Leukemia. 21:18–29 - PubMed
    1. Blair A., Zahm S.H., Pearce N.E., Heineman E.F., Fraumeni J.F. 1992. Clues to cancer etiology from studies of farmers.Scand. J. Work Environ. Health. 18:209–215 - PubMed
    1. Carlotti E., Wrench D., Matthews J., Iqbal S., Davies A., Norton A., Hart J., Lai R., Montoto S., Gribben J.G., et al. 2009. Transformation of follicular lymphoma to diffuse large B-cell lymphoma may occur by divergent evolution from a common progenitor cell or by direct evolution from the follicular lymphoma clone.Blood. 113:3553–3557 - PubMed
    1. Chiu B.C., Dave B.J., Blair A., Gapstur S.M., Zahm S.H., Weisenburger D.D. 2006. Agricultural pesticide use and risk of t(14;18)-defined subtypes of non-Hodgkin lymphoma.Blood. 108:1363–1369 - PMC - PubMed

Publication types

MeSH terms