. 2010 Jun;14(6B):1726-39.
doi: 10.1111/j.1582-4934.2009.00801.x. Epub 2009 Jun 5.

Interleukin-33 overexpression is associated with liver fibrosis in mice and humans

Affiliations

Interleukin-33 overexpression is associated with liver fibrosis in mice and humans

Pierrick Marvie et al. J Cell Mol Med. 2010 Jun.

Abstract

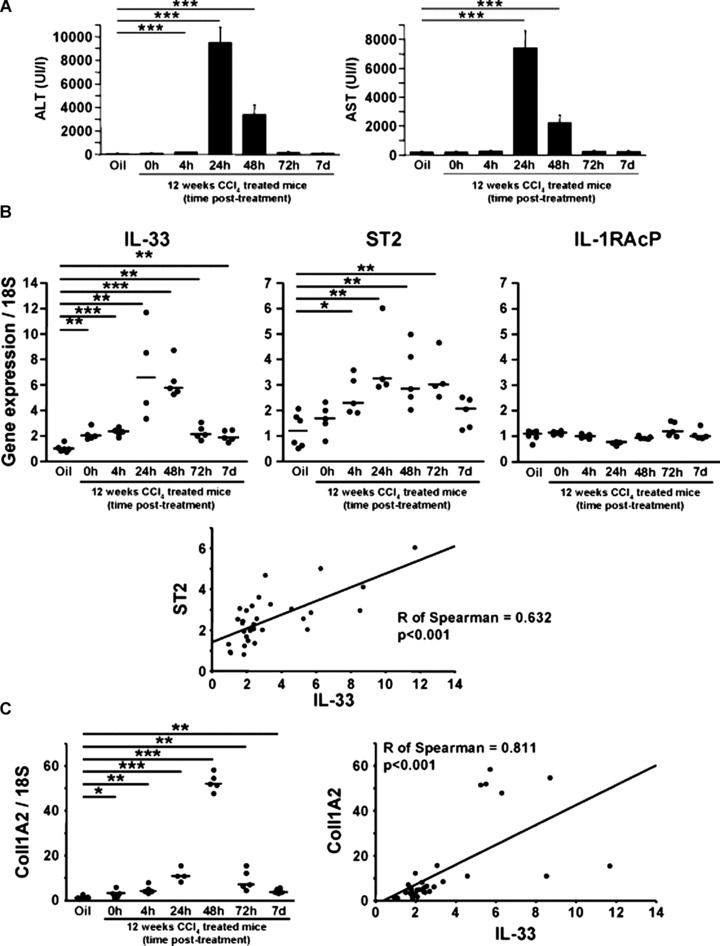
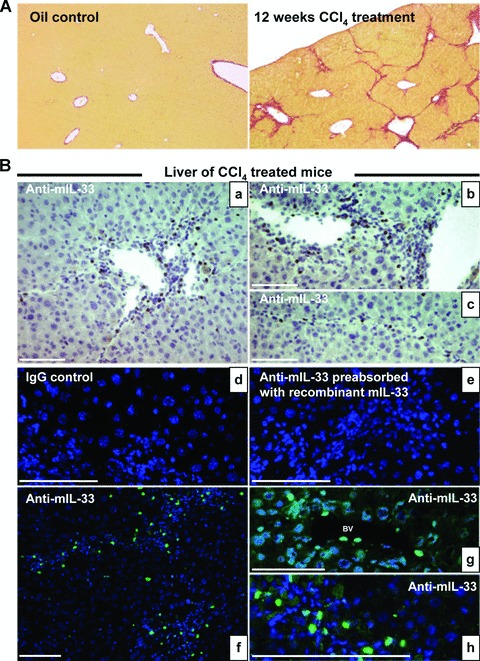
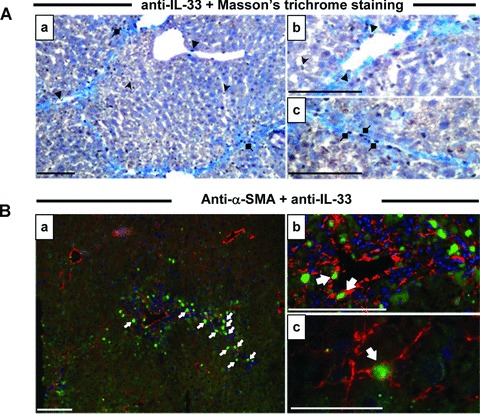
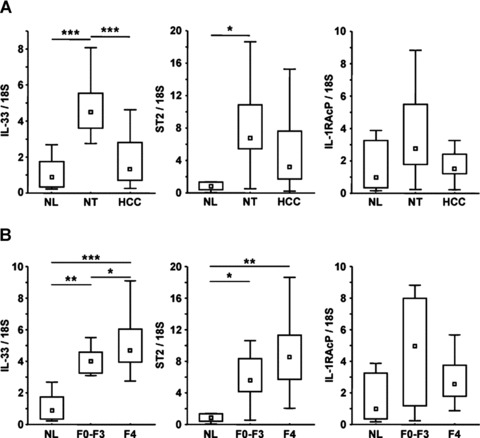
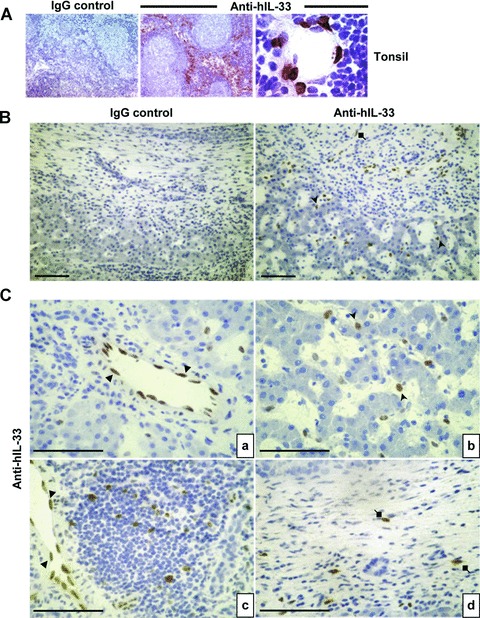
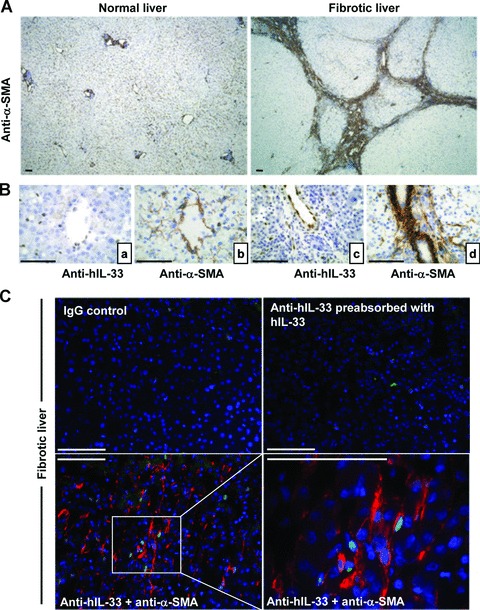
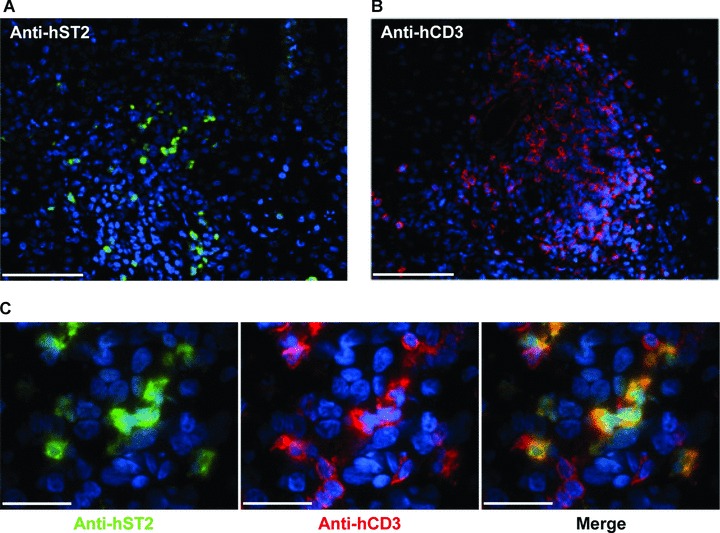
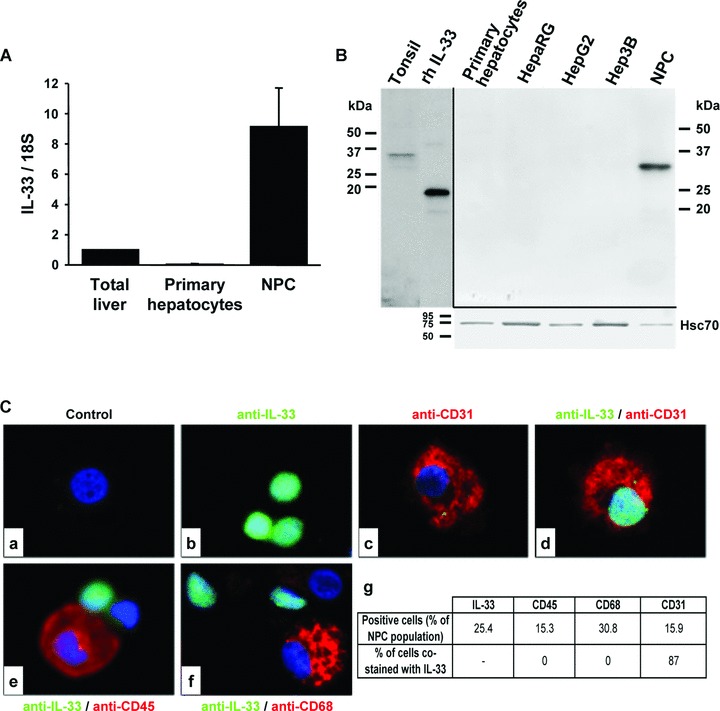
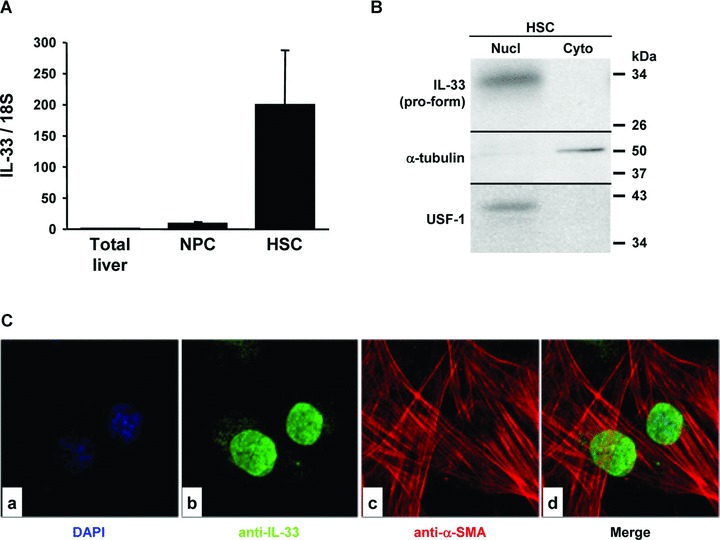
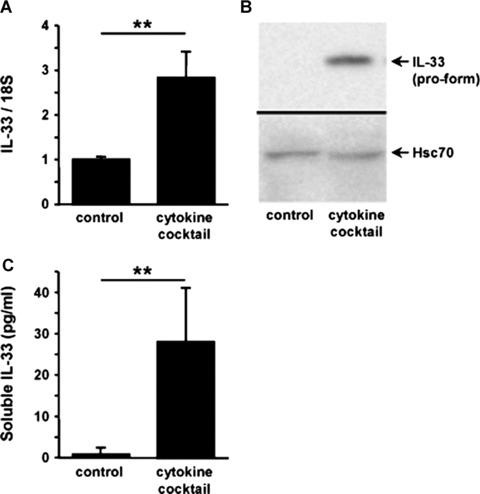
Interleukin-33 (IL-33), the most recently identified member of the IL-1 family, induces synthesis of T Helper 2 (Th2)-type cytokines via its heterodimeric ST2/IL-1RAcP receptor. Th2-type cytokines play an important role in fibrosis; thus, we investigated the role of IL-33 in liver fibrosis. IL-33, ST2 and IL-1RAcP gene expression was analysed in mouse and human normal (n= 6) and fibrotic livers (n= 28), and in human hepatocellular carcinoma (HCC; n= 22), using real-time PCR. IL-33 protein was detected in normal and fibrotic liver sections and in isolated liver cells using Western blotting and immunolocalization approaches. Our results showed that IL-33 and ST2 mRNA was overproduced in mouse and human fibrotic livers, but not in human HCC. IL-33 expression correlated with ST2 expression and also with collagen expression in fibrotic livers. The major sources of IL-33 in normal liver from both mice and human beings are the liver sinusoidal endothelial cells and, in fibrotic liver, the activated hepatic stellate cells (HSC). Moreover, IL-33 expression was increased in cultured HSC when stimulated by pro-inflammatory cytokines. In conclusion, IL-33 is strongly associated with fibrosis in chronic liver injury and activated HSC are a source of IL-33.


Figures

Fig 1
Fig 1
IL-33 mRNA is overexpressed in mouse liver fibrosis. (A) Blood levels of ALT and AST in C57Bl/6 mice treated for 12 weeks with CCl4. Real-time PCR analysis of mRNA levels of IL-33, ST2 and IL-1RAcP (B) and collagen 1A2 (C) in oil control (Oil) and livers from C57Bl/6 mice treated for 12 weeks with CCl4 and killed 0, 4, 24, 48 and 72 hrs or 7 days after the last administration of CCl4. Expression levels for genes of interest are expressed as ratios relative to 18S levels. P-values for differences between populations were determined with Student’s t-test (*P < 0.05; **P < 0.01; ***P < 0.001). Graphic representation of the Spearman’s rank correlation coefficient between IL-33 and ST2 (B) and between IL-33 and collagen 1A2 (C).
Fig 2
Fig 2
IL-33 distribution in mouse liver sections. (A) Photomicrographs of liver sections stained with Sirius red from mice treated for 12 weeks with CCl4 (right) or oil (left). (B) Immunohistochemistry on frozen liver sections from oil- or CCl4-treated mice, killed 24 hrs after the last administration of CCl4 as indicated, was performed with the non-specific IgG control, the antimouse IL-33 pre-absorbed with the recombinant mouse IL-33, the antimouse IL-33 antibody and fluoresceine iso thio cyanate conjugated secondary antibodies were used. Nuclei were counterstained with diaminobenzidine. Cells staining positive for IL-33 are indicated with full white arrows. BV: blood vessel; LSEC: liver sinusoidal endothelial cell. Scale bars represent 100 μm.
Fig 3
Fig 3
IL-33 co-localization with α-SMA in mouse liver sections. (A) Immunohistochemistry on frozen liver sections from CCl4-treated mice, killed 24 hrs after the last administration of CCl4, was performed with the antimouse IL-33 antibody and counterstained according to the Masson’s trichrome protocol (A) or co-localized with the Cy3-α–SMA antibody (B). Cells staining positive for IL-33 are indicated with full arrows (endothelial cells), arrowheads (sinusoidal cells) and diamonds (fibrous scar cells). Scale bars represent: 40 μm for Bc, 100 μm for others.
Fig 4
Fig 4
IL-33 and ST2 are overexpressed in human fibrotic and cirrhotic liver. (A) Real-time qPCR analysis of IL-33, ST2 and IL-1RAcP mRNA levels in NL (n= 6), NT (n= 28) and HCC (n= 22). (B) Real-time qPCR analysis of IL-33, ST2 and IL-1RAcP mRNA levels in NL (n= 6) and in NT classified as fibrosis (F0-F3; n= 8) or cirrhosis (F4; n= 20). Results are expressed as ratios relative to 18S. P-values for differences between populations were determined with the Student–Newman–Keuls multiple comparison test (*P < 0.05; **P < 0.01; ***P < 0.001).
Fig 5
Fig 5
IL-33 distribution in human liver sections. Immunohistochemistry was performed with isotype controls or anti-IL-33 (Nessy-1) on frozen sections of human healthy tonsils (A) or of human livers (B and C). Cells staining positive for IL-33 are indicated with full arrows (endothelial cells), arrowheads (sinusoidal cells) and diamonds (fibrous scar cells). Scale bars represent 100 μm.
Fig 6
Fig 6
IL-33 co-localization with α-SMA in human liver sections. (A) Immunohistochemistry was performed with anti-α-SMA (clone 1A2) which stained the smooth muscle cells and activated HSC in human NL (left) and in fibrotic liver (right). (B) Serial sections of fibrotic livers were stained with anti-human IL-33 (Nessy-1) or anti-α-SMA. (C) Immunohistochemistry on frozen human fibrotic liver sections was performed with non-specific IgG, with anti-human IL-33 (Nessy-1) pre-absorbed with recombinant human IL-33 (Nessy-1), or with anti-human IL-33 antibody plus Cy3-αSMA antibody. Nuclei were counterstained with diaminobenzidine. Scale bars represent 100 μm.
Fig 7
Fig 7
ST2 receptor co-localization with CD3 in human fibrotic liver sections. Immunohistochemistry on frozen human fibrotic liver sections was performed with fluoresceine iso thio cyanate labelled murine anti-human ST2 antibody (A, green) and with anti-CD3 antibody revealed with cyanin-3 labelled goat anti-rabbit IgG antibody (B, red). Scale bars represent 100 μm. (C) Merged images illustrate co-localization of ST2 and CD3. Scale bars represent 40 μm. For all pictures, nuclei were counterstained with diaminobenzidine.
Fig 8
Fig 8
IL-33 pro-form is present in liver sinusoidal endothelial cells. (A) Real-time qPCR analysis of IL-33 mRNA levels in total NL, human primary cultured hepatocytes and in NPC. Results are expressed as ratios relative to 18S and are the average of three independent experiments. (B) Detection by Western blot of IL-33 in primary human hepatocytes, HepaRG, HepG2, Hep3B and NPC. (C) Immunocytochemistry was performed in liver NPC with anti-IL-33 (b, d, e, f; AT110; green) and anti-CD31 (c, d), anti-CD45 (e) or anti-CD68 (f) antibodies (red). Control experiment with IgG is shown (a). The table ‘g’ summarizes the percentage of cells that were positive for the different markers labelling the NPC spotted on slides by Cytospin®. More than 300 cells were counted per slides (n= 3).
Fig 9
Fig 9
IL-33 is expressed by activated HSC. (A) Real-time qPCR analysis of IL-33 mRNA levels in total NL, NPC and culture-activated HSC. Results are expressed as ratios relative to 18S and are the average of three independent experiments. (B) Western blot of IL-33, α-tubulin and USF-1 in nuclear (Nucl) and cytosolic (Cyto) subcellular fractions prepared from activated HSC. (C) Immunolocalization of IL-33 (b, d; AT110; green) and α-SMA (c, d; red) in cultured HSC.
Fig 10
Fig 10
IL-33 in HSC is increased by pro-inflammatory cytokine stimulation. (A) Real-time qPCR analysis of IL-33 mRNA levels in activated human HSC stimulated for 6 hrs with a cytokine cocktail (IL-1β, IL-6, TNF-α and IFN-γ). Results are expressed as ratios relative to 18S and are the average of three experiments. Detection of intracellular IL-33 pro-form by Western blot (B) or of soluble IL-33 in the conditioned media by ELISA (C) was performed in activated HSC stimulated for 24 hrs with the cytokine cocktail. Results are the average of three independent experiments (**P < 0.01).

Similar articles

Cited by

References

    1. Friedman SL. Liver fibrosis – from bench to bedside. J Hepatol. 2003;38:S38–53. - PubMed
    1. Gressner AM, Weiskirchen R. Modern pathogenetic concepts of liver fibrosis suggest stellate cells and TGF-beta as major players and therapeutic targets. J Cell Mol Med. 2006;10:76–99. - PMC - PubMed
    1. Wynn TA. Fibrotic disease and the T(H)1/T(H)2 paradigm. Nat Rev Immunol. 2004;4:583–94. - PMC - PubMed
    1. Baekkevold ES, Roussigne M, Yamanaka T, et al. Molecular characterization of NF-HEV, a nuclear factor preferentially expressed in human high endothelial venules. Am J Pathol. 2003;163:69–79. - PMC - PubMed
    1. Onda H, Kasuya H, Takakura K, et al. Identification of genes differentially expressed in canine vasospastic cerebral arteries after subarachnoid hemorrhage. J Cereb Blood Flow Metab. 1999;19:1279–88. - PubMed

MeSH terms