. 2009 Jun;7(6):809-20.
doi: 10.1158/1541-7786.MCR-08-0571. Epub 2009 Jun 9.

Epidermal growth factor receptor-mediated membrane type 1 matrix metalloproteinase endocytosis regulates the transition between invasive versus expansive growth of ovarian carcinoma cells in three-dimensional collagen

Affiliations

Epidermal growth factor receptor-mediated membrane type 1 matrix metalloproteinase endocytosis regulates the transition between invasive versus expansive growth of ovarian carcinoma cells in three-dimensional collagen

Natalie M Moss et al. Mol Cancer Res. 2009 Jun.

Abstract

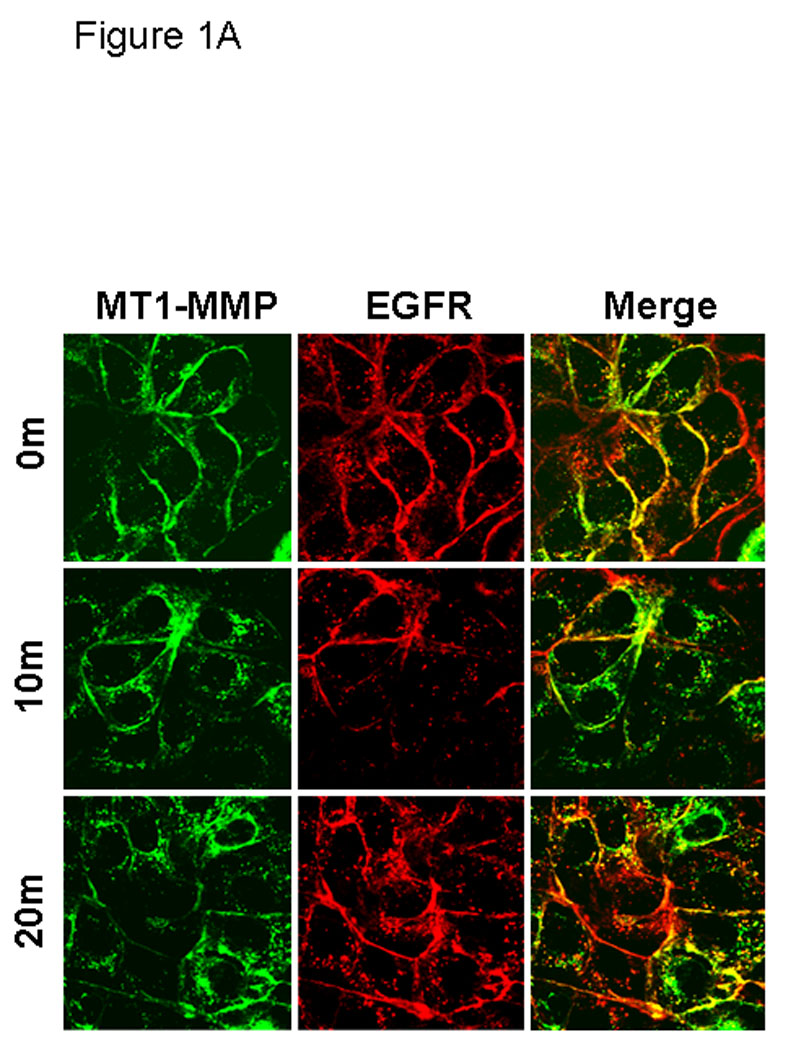
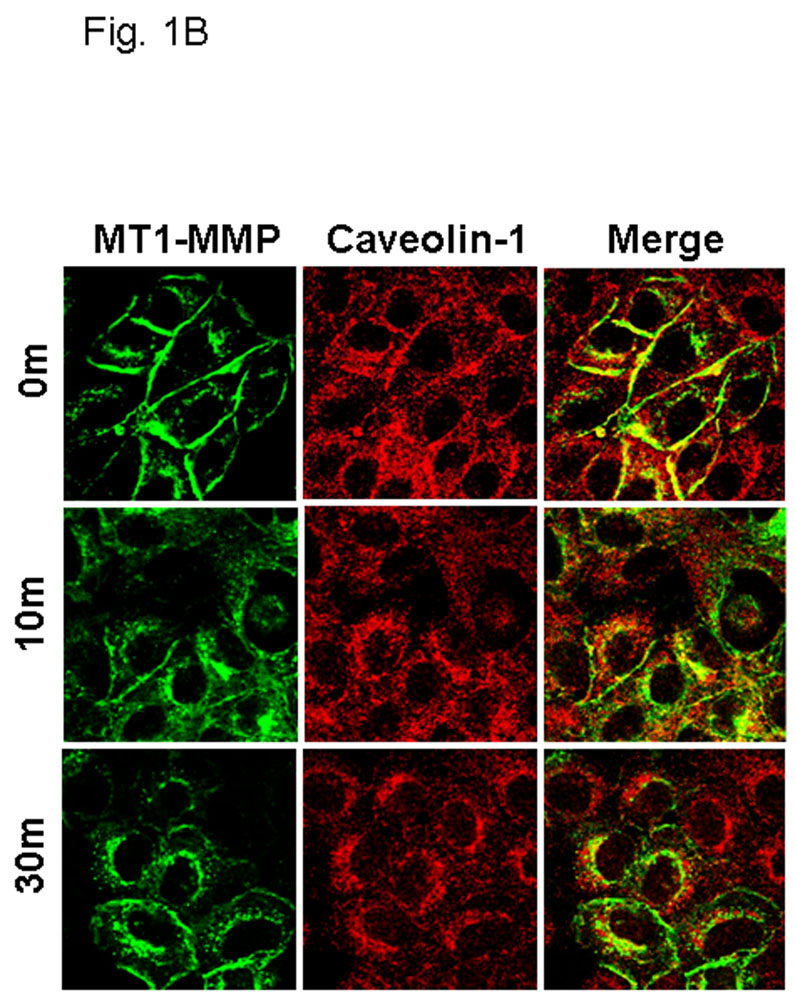
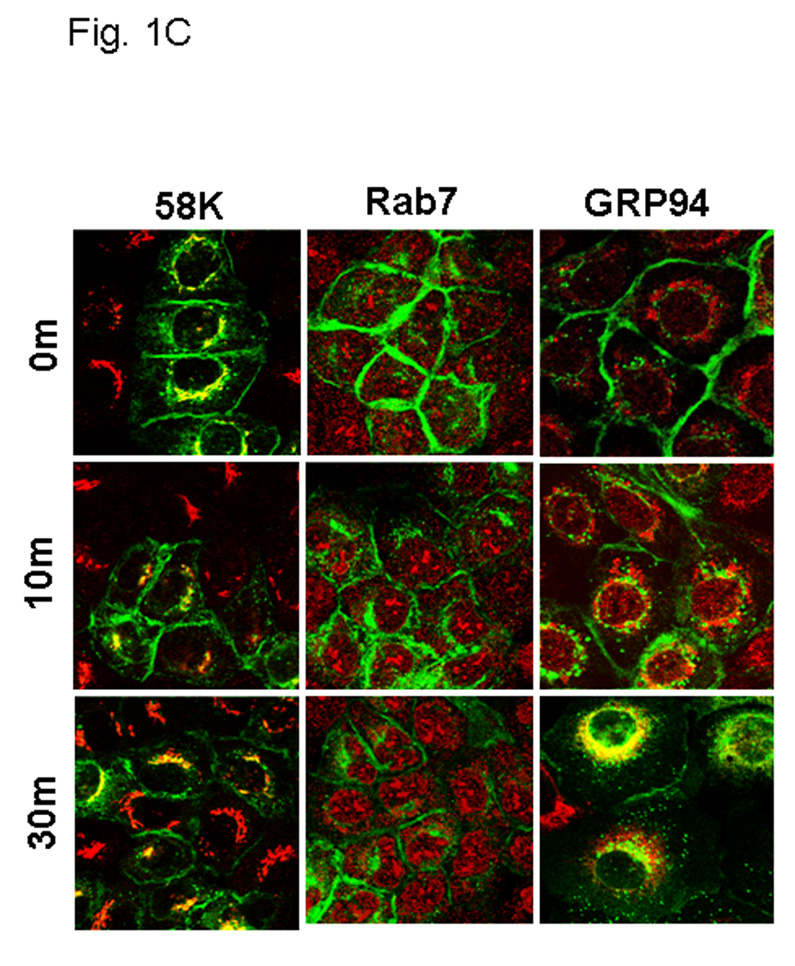
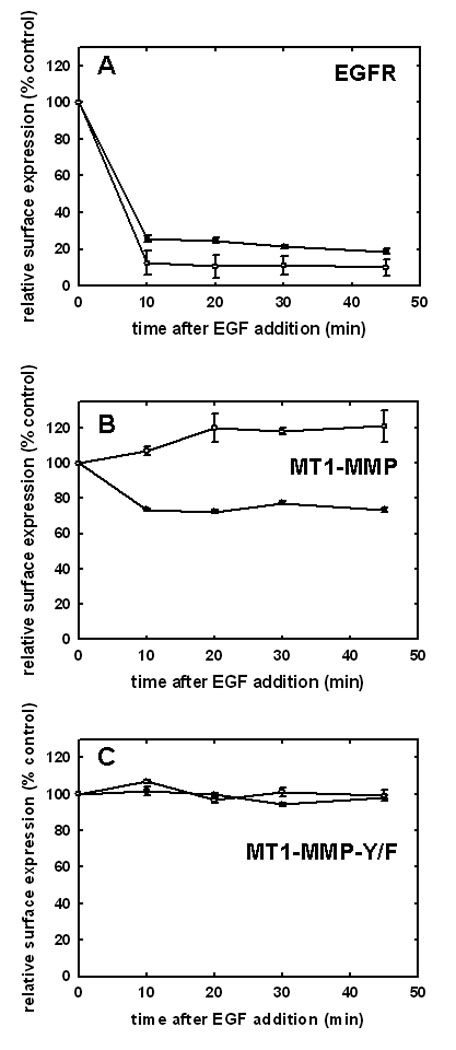
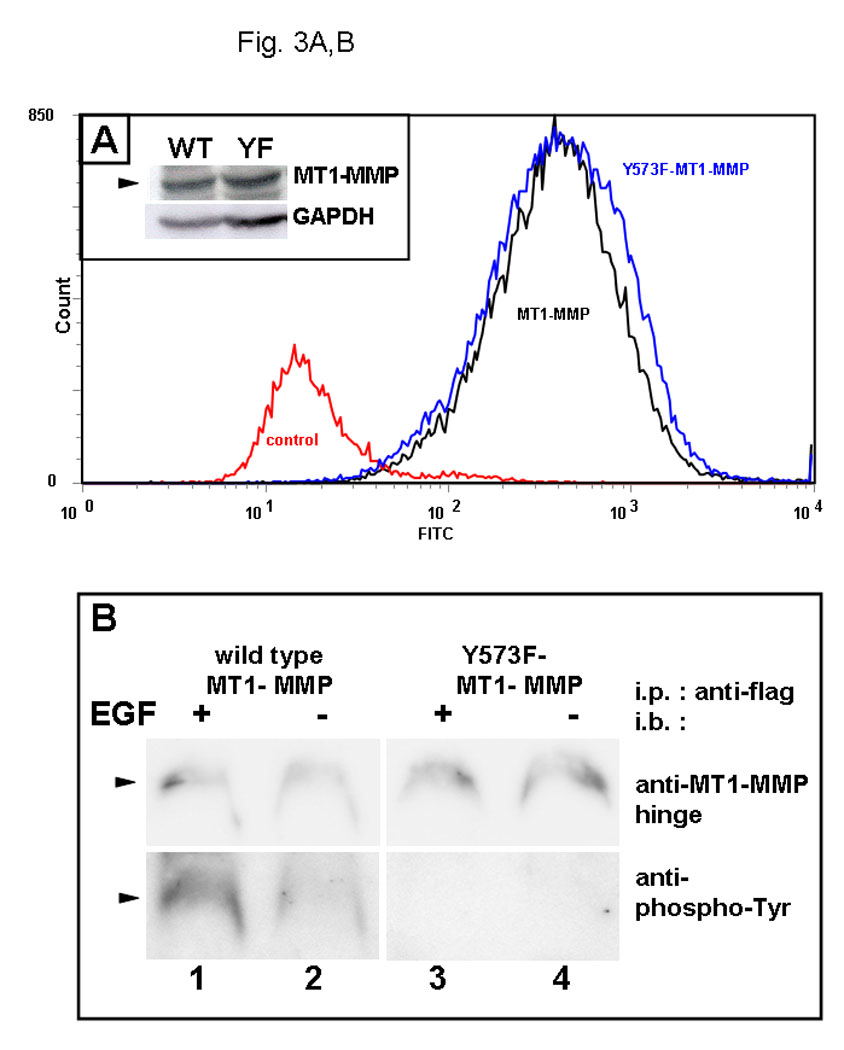
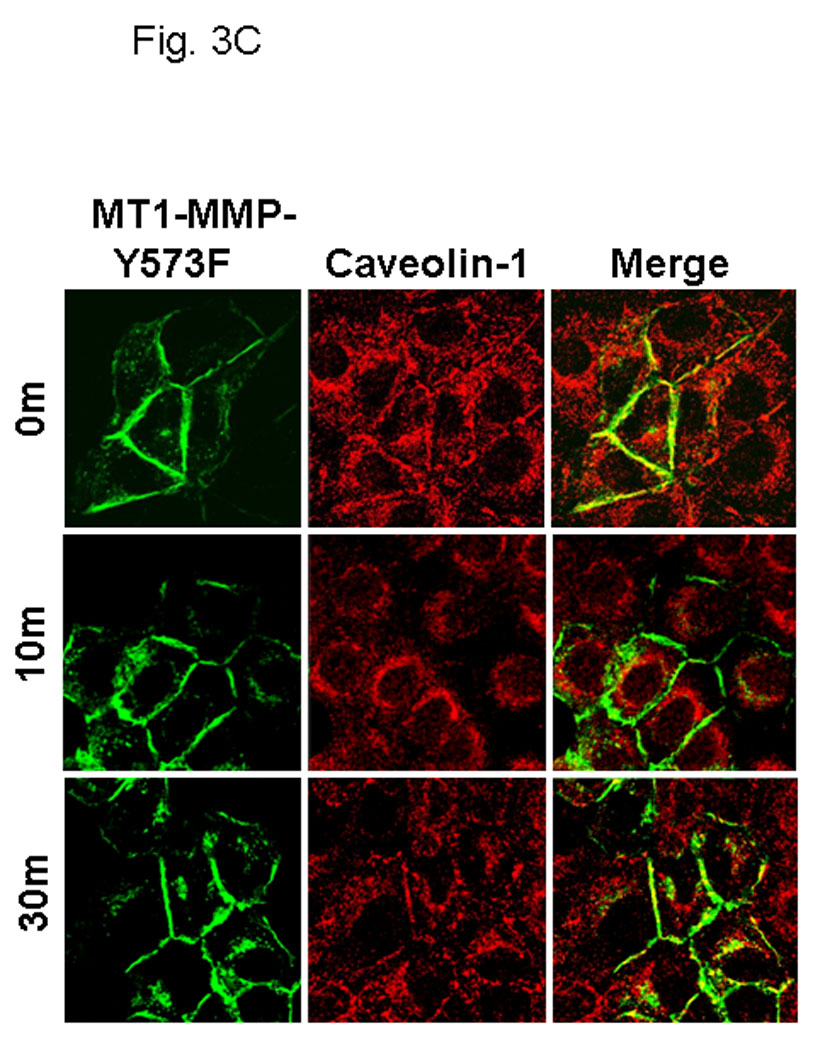
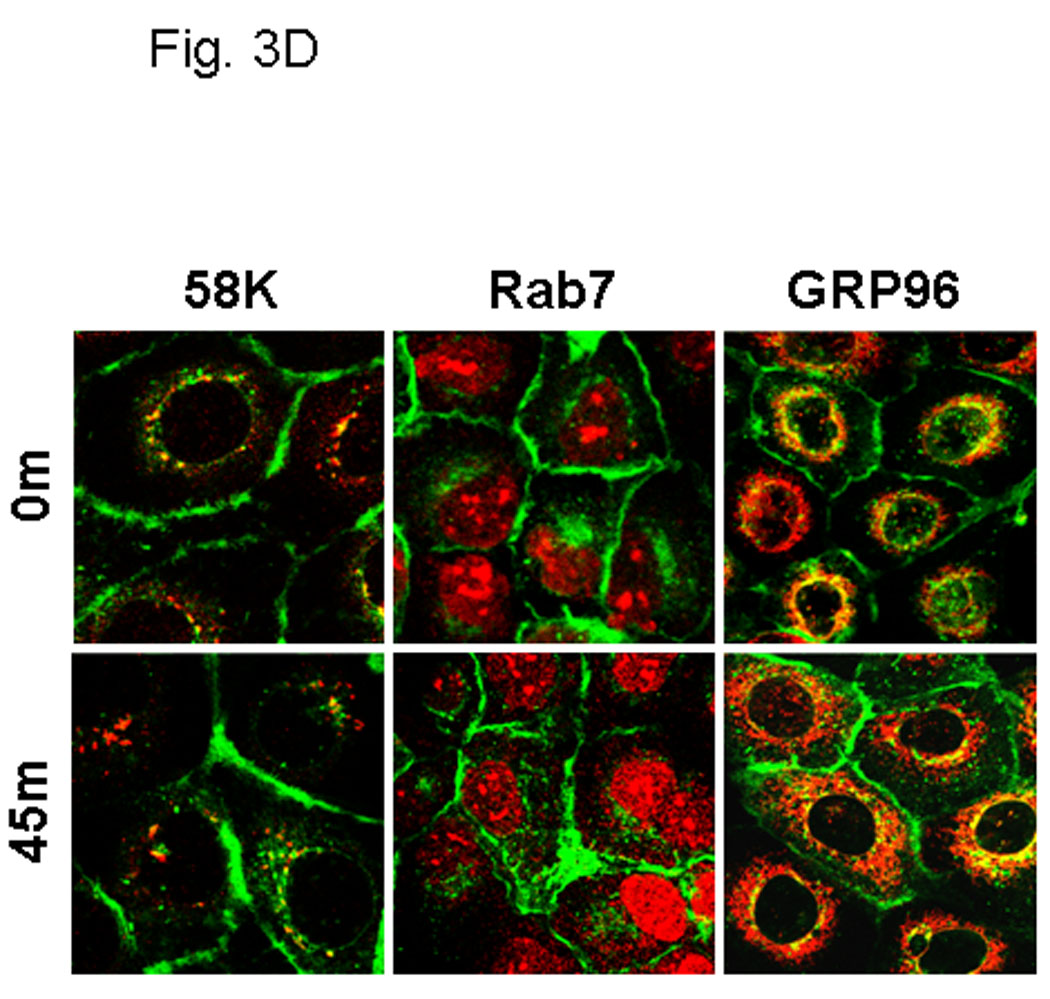
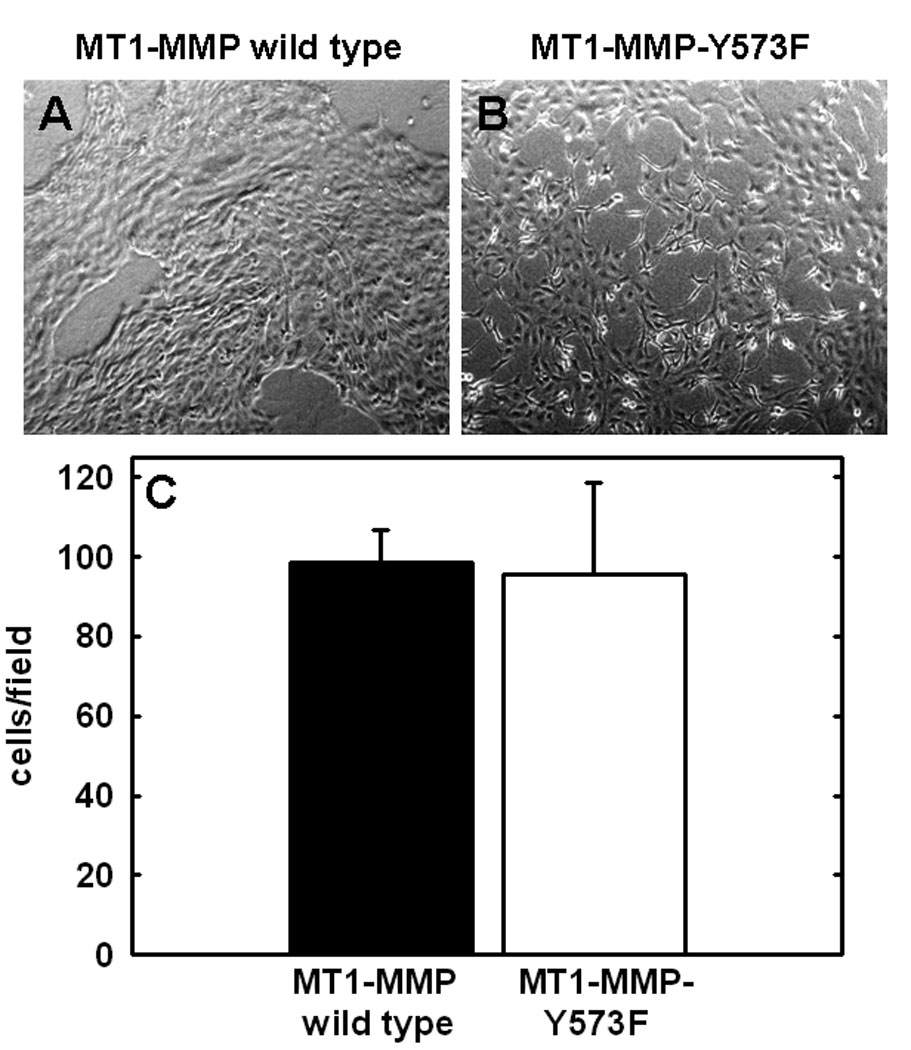
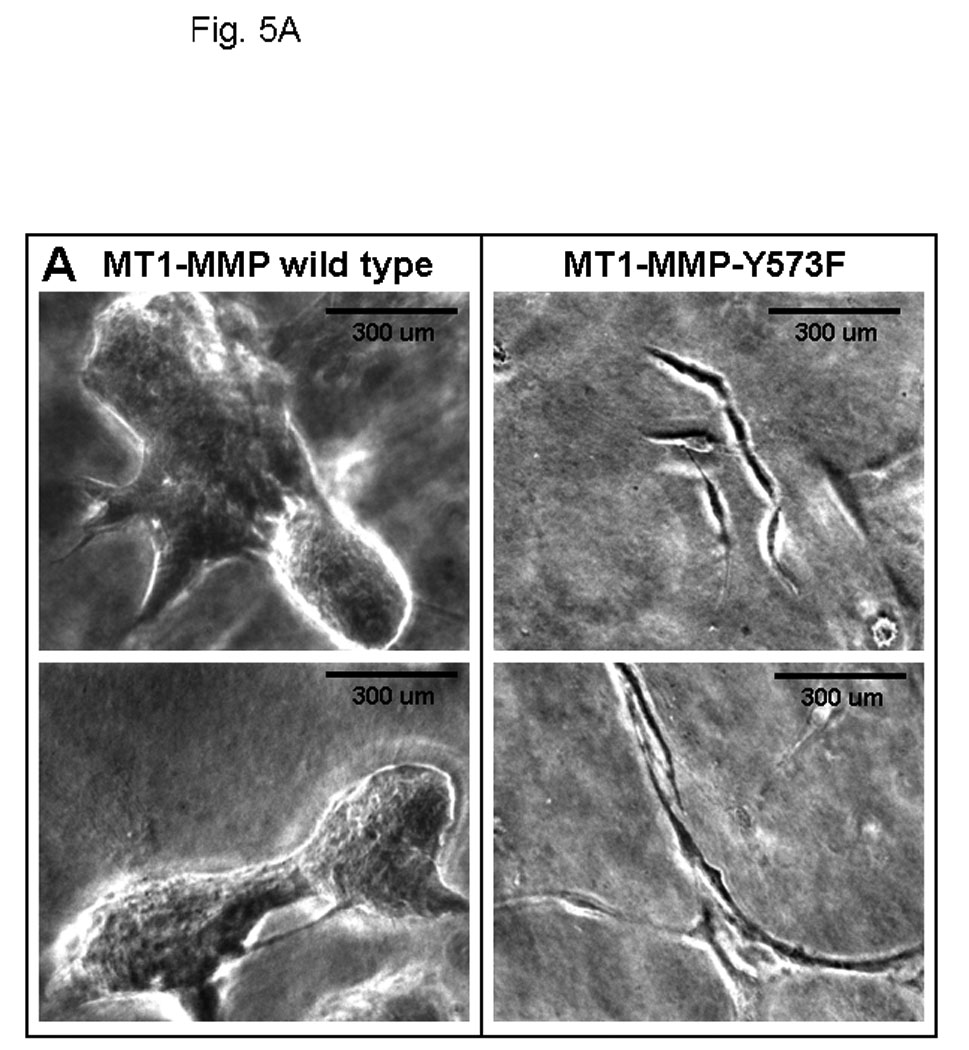
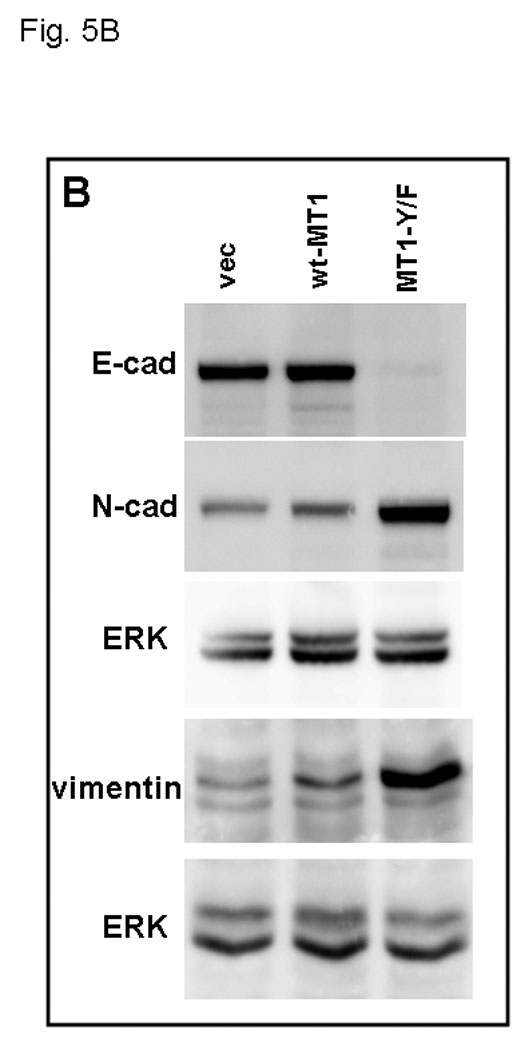
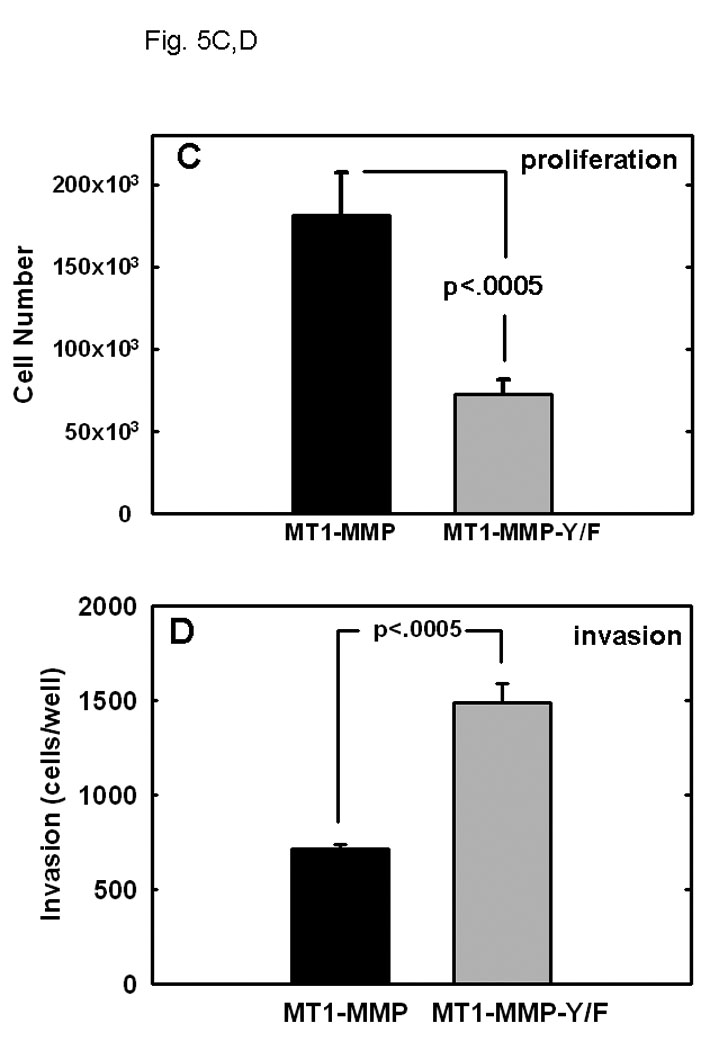
The epidermal growth factor receptor (EGFR) is overexpressed in ovarian carcinomas and promotes cellular responses that contribute to ovarian cancer pathobiology. In addition to modulation of mitogenic and motogenic behavior, emerging data identify EGFR activation as a novel mechanism for rapid modification of the cell surface proteome. The transmembrane collagenase membrane type 1 matrix metalloproteinase (MT1-MMP, MMP-14) is a major contributor to pericelluar proteolysis in the ovarian carcinoma microenvironment and is subjected to extensive posttranslational regulation. In the present study, the contribution of EGFR activation to control of MT1-MMP cell surface dynamics was investigated. Unstimulated ovarian cancer cells display caveolar colocalization of EGFR and MT1-MMP, whereas EGFR activation prompts internalization via distinct endocytic pathways. EGF treatment results in phosphorylation of the MT1-MMP cytoplasmic tail, and cells expressing a tyrosine mutated form of MT1-MMP (MT1-MMP-Y(573)F) exhibit defective MT1-MMP internalization. As a result of sustained cell surface MT1-MMP activity, a phenotypic epithelial-mesenchymal transition is observed, characterized by enhanced migration and collagen invasion, whereas growth within three-dimensional collagen gels is inhibited. These data support an EGFR-dependent mechanism for regulation of the transition between invasive and expansive growth of ovarian carcinoma cells via modulation of MT1-MMP cell surface dynamics.


Figures

Figure 1
Figure 1. EGFR activation modulates MT1-MMP surface dynamics
(A) Cells expressing GFP-tagged MT1-MMP were serum starved overnight and treated with EGF (25nm) for the indicated times in serum free medium and processed for staining with anti-EGFR (red) as described in Experimental Procedures. All images were viewed using the 63 × 1.4 oil immersion objective. (B) Cells were treated as in A, and processed for staining with anti-caveolin-1 (red) antibodies as described in Experimental Procedures. (C) GFP-tagged MT1-MMP-expressing cells were treated as in A and processed for staining with either Rab7, 58K or GRP96 (red) as indicated. Only merged images are shown.
Figure 2
Figure 2. EGFR activation alters surface presentation
Surface levels of (A) EGFR, (B) MT1-MMP or (C) MT1-MMP-Y573F were quantified at the indicated time points using flow cytometry following treatment with EGF (25 nM) in control (closed circles) or methyl-β-cyclodextrin-treated cells (open circles). Cells were serum starved, treated with EGF, and trypsinized on ice at the indicated time points prior to processing for flow cytometry using anti-Flag antibody (1:100) to detect MT1-MMP or anti-EGFR antibody (1:100) to detect EGFR. Alexa Fluor 488-conjugated goat anti-mouse IgG (1:200) was used as a secondary antibody. Data are normalized such that surface expression in the absence of EGF treatment is designated as 100%. Assays were performed with 3–6 replicates.
Figure 3
Figure 3. Altered surface dynamics in MT1-MMP-Y573F-expressing cells
(A) Cells were analyzed by flow cytometry for expression levels of wild type MT1-MMP (black trace) or MT1-MMP-Y573F (blue trace) relative to vector controls (red trace) as described in Experimental Procedures. Inset: western blot of whole cell lysates from cells expressing wild type (WT) or mutant (YF) MT1-MMP. Blot was probed with anti-MT1-MMP (hinge antibody) or anti-GAPDH as described in Experimental Procedures. (B) Cells were cultured overnight in serum free medium prior to treatment with EGF (25 nM) for 30 min, as indicated. Following treatment, cells were lysed, immunoprecipitated using anti-FLAG M2 antibody and immunoprecipitates probed with antibodies to MT1-MMP (hinge, upper panel) or phospho-Tyr (lower panel) (C) Cells expressing GFP-tagged MT1-MMP-Y573F were serum starved overnight and treated with EGF (25nm) for the indicated times in serum free medium and processed for staining with anti-caveolin-1 (red) as described in Experimental Procedures. (D) GFP-tagged MT1-MMP-Y573F expressing cells were treated as in D and processed for staining with either Rab7, 58K or GRP96 (red) as indicated. Only merged images are shown.
Figure 4
Figure 4. MT1-MMP-Y573F modification does not alter two-dimensional growth
Cells expressing (A) wild type MT1-MMP or (B) MT1-MMP-Y573F, as indicated, were seeded at an initial density of 5×10⁴ cells/well atop thin layer collagen-coated culture wells and allowed to proliferate. (C) Following incubation at 37°C for 6 days, collagen cultures were photographed prior to dissolution using bacterial collagenase (2mg/ml, Worthington) and cell number was evaluated by hemocytometry as described [52,53].
Figure 5
Figure 5. MT1-MMP-Y573F alters invasive versus expansive growth in three-dimensional collagen
(A) An equal number of cells (5×10⁴) expressing wild type MT1-MMP or MT1-MMP-Y573F, as indicated, were seeded at low density within three dimensional collagen cultures prepared by adding cells to type I collagen prior to solidification as described in Experimental Procedures. Two representative images of each culture are shown following incubation at 37 C for 6 days. (B) Expression of MT1-MMP-Y573F is associated with acquisition of mesenchymal markers. Cells expressing wild type MT1-MMP or MT1-MMP-Y573F were lysed, lysates electrophoresed and transferred to Immobilon. Blots were probed with antibodies directed against E-cadherin, N-cadherin, or vimentin, as indicated. GAPDH is shown as a loading control. (C) Wild type MT1-MMP enhances proliferation in three-dimensional collagen. Following incubation at 37°C for 6 days, three dimensional collagen cultures were dissolved using bacterial collagenase (2 mg/ml, Worthington) and cell number was evaluated by hemocytometry as described [53]. Experiments were repeated in triplicate. Wild-type MT1-MMP enhances proliferation relative to untransfected controls (not shown; 122,431 +/− 3519 cells/gel) and proliferation is inhibited by polymerization of TIMP-2 (5 ug/ml) within the gels (not shown; 121,293 +/− 2158 cells/gel). (D) Invasion of three-dimensional collagen gels was analyzed by incubating cells (250,000) in a Boyden chamber containing an 8 um porous filter overlaid with 100 ul of type I collagen (200ug/ml) for 24 hours at 37°Celsius. Non-invading cells were removed and invading cells were enumerated. Results are from averages of three independent experiments.

References

    1. Carpenter G, Cohen S. Epidermal growth factor. J. Biol. Chem. 1998;265:7709–7712. - PubMed
    1. Wells A. EGF receptor. Int J. Biochem. Cell Bio. 1999;31:637–643. - PubMed
    1. Yarden Y, Sliwkowski MX. Untangling the ErbB signaling network. Nat. Rev. Mol. Cell. Biol. 2001;2:127–137. - PubMed
    1. Lafky JM, Wilken JA, Baron AT, Maihle NJ. Clinical implications of the ErbB/epidermal growth factor (EGF) receptor family and its ligands in ovarian cancer. Biochimica et Biophysica Acta. 2008;1785:232–265. - PubMed
    1. Jorissen RN, Walker F, Pouli N, Garrett T, Ward C, Burgess A. Epidermal growth factor receptor: mechanisms of activation and signaling. Exp. Cell Res. 2003;284:31–53. - PubMed

Publication types