. 2009 Aug;297(2):E410-5.
doi: 10.1152/ajpendo.00042.2009. Epub 2009 Jun 9.

Glucagon acts in a dominant manner to repress insulin-induced mammalian target of rapamycin complex 1 signaling in perfused rat liver

Affiliations

Glucagon acts in a dominant manner to repress insulin-induced mammalian target of rapamycin complex 1 signaling in perfused rat liver

Jamie I Baum et al. Am J Physiol Endocrinol Metab. 2009 Aug.

Abstract

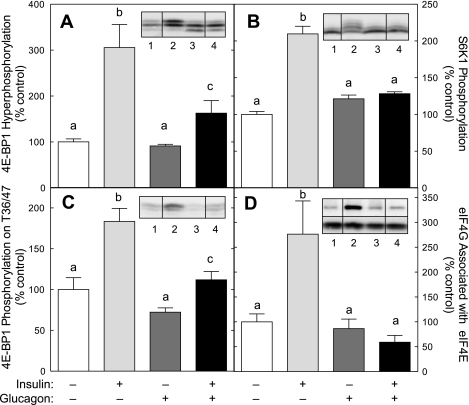
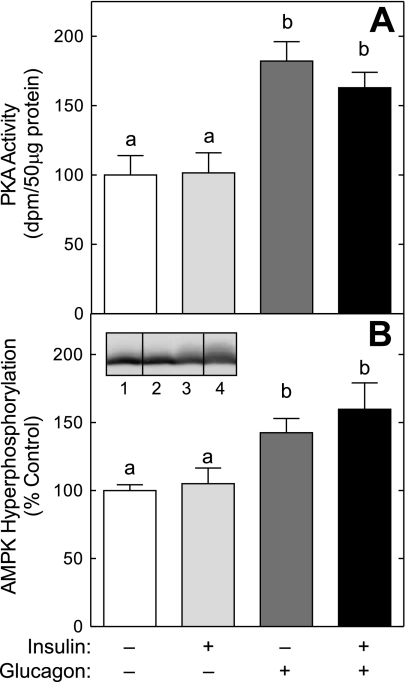
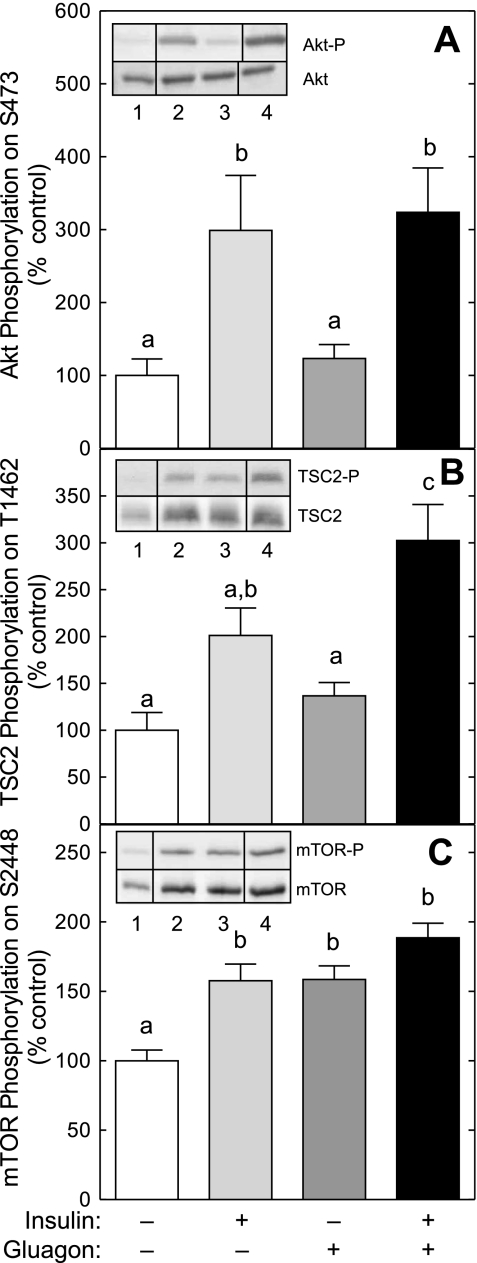
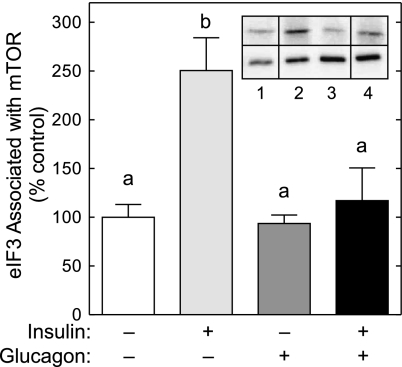
The opposing actions of insulin and glucagon on hepatic carbohydrate metabolism are well documented. In contrast, relatively little is known about how the two hormones interact to regulate hepatic protein metabolism. Previously, we reported that glucagon in the absence of insulin represses signaling through the mammalian target of rapamycin complex 1 (mTORC1). In the present study, we sought to determine whether or not the action of one hormone would dominate over the other in the regulation of mTORC1 signaling. Livers were perfused in situ with medium containing either no added hormones (control), 10 nM insulin, 100 nM glucagon, or a combination of the hormones. Compared with control livers, insulin stimulated Akt phosphorylation and mTORC1 signaling, as assessed by increased phosphorylation of the mTORC1 targets eIF4E-binding protein (4E-BP)1 and ribosomal protein S6 kinase (S6K)1, and promoted assembly of the eIF4G x eIF4E complex. Glucagon alone had no effect on mTORC1 signaling but stimulated the activity of protein kinase A (PKA). In the presence of a combination of insulin and glucagon, Akt and TSC2 phosphorylation and PKA activity were all increased compared with controls. However, mTORC1 signaling was repressed compared with livers perfused with medium containing insulin alone, and this effect was associated with reduced assembly of the mTORC1 x eIF3 complex. Overall, the results suggest that glucagon acts in a dominant manner to repress insulin-induced mTORC1 signaling, which is in contrast to previous studies showing a dominant action of insulin in the control of hepatic gluconeogenesis.


Figures

Fig. 1.
Fig. 1.
Glucagon represses the insulin-induced activation of mammalian target of rapamycin (mTOR) complex 1 (mTORC1). Rat livers were perfused in situ for 20 min in the absence of hormones or in the presence of 100 nM glucagon and/or 10 nM insulin, as described in materials and methods. Phosphorylation of eukaryotic initiation factor (eIF)4E-binding protein (4E-BP1; A) and ribosomal protein S6 kinase 1 (S6K1; B) was measured as changes in electrophoretic mobility assessed by Western blot analysis, as described in materials and methods. C: phosphorylation of 4E-BP1 on Thr36/47 was measured by Western blot analysis using an antibody that specifically recognizes the protein only when it is phosphorylated on Thr36 and/or Thr47. D: the association of eIF4G with eIF4E was examined by immunoprecipitating eIF4E from liver homogenates and measuring the amount of eIF4E and eIF4G in the immunoprecipitates by Western blot analysis. Inserts show representative blots. The samples shown were analyzed on the same gel, but not necessarily in contiguous lanes. Lane 1, control liver; lane 2, livers perfused in the presence of insulin; lane 3, livers perfused in the presence of glucagon; lane 4, livers perfused in the presence of both glucagon and insulin. D, top insert: typical blot for eIF4G. D, bottom insert: typical blot for eIF4E. The results represent the mean ± SE for 6 (S6K1), 10 (4E-BP1 phosphorylation and eIF4G association with eIF4E), or 12 (4E-BP1 phosphorylation on Thr36/47) livers/condition. Values not sharing the same letter are significantly different (P < 0.05).
Fig. 2.
Fig. 2.
Glucagon, but not insulin, activates PKA and promotes AMP-activated protein kinase (AMPK) phosphorylation. Livers were perfused as described in the legend to Fig. 1. A: PKA activity was measured using a kit from Upstate Cell Signaling Solutions, as described previously (15). B: AMPK phosphorylation was measured as a decrease in migration during SDS-polyacrylamide gel electrophoresis, as described in materials and methods. Each sample was analyzed on the same blot, but not in contiguous lanes on the gel. Lane 1, control liver; lane 2, livers perfused in the presence of insulin; lane 3, livers perfused in the presence of glucagon; lane 4, livers perfused in the presence of both glucagon and insulin. The results represent the mean ± SE of 6 livers/condition. Values not sharing the same letter are significantly different (P < 0.05).
Fig. 3.
Fig. 3.
Glucagon does not prevent the insulin-induced increase in Akt, tuberous sclerosis complex 2 (TSC2), or mTOR phosphorylation. Livers were perfused as described in the legend to Fig. 1. Phosphorylation of Akt on Ser473 (A), TSC2 on Thr1462 (B), and mTOR on Ser2448 (C) was assessed by Western blot analysis using antibodies that specifically recognize the phosphorylated forms of the proteins. Inserts show representative blots. The samples shown were analyzed on the same gel, but not necessarily in contiguous lanes. Lane 1, control liver; lane 2, livers perfused in the presence of insulin; lane 3, livers perfused in the presence of glucagon; lane 4, livers perfused in the presence of both glucagon and insulin. The results were normalized for the total amounts of the respective protein and are presented as means ± SE of 5–6 (Akt and mTOR) or 12 (TSC2) livers/condition. Values not sharing the same letter are significantly different (P < 0.05). There is also a trend (P = 0.06) for insulin alone to increase TSC2 phosphorylation compared with glucagon alone.
Fig. 4.
Fig. 4.
Glucagon prevents the insulin-stimulated association of eIF3 with mTOR. Livers were perfused as described in the legend to Fig. 1. The association of eIF3 with mTOR was examined by immunoprecipitating mTOR from liver homogenates and measuring the amount of mTOR and eIF3 in the immunoprecipitates by Western blot analysis. Insert shows representative blots. The samples shown were analyzed on the same gel, but not necessarily in contiguous lanes. Lane 1, control liver; lane 2, livers perfused in the presence of insulin; lane 3, livers perfused in the presence of glucagon; lane 4, livers perfused in the presence of both glucagon and insulin. Top blot: typical blot for eIF3; bottom blot: typical blot for mTOR. The results represent the mean ± SE for 6 livers/condition. Values not sharing the same letter are significantly different (P < 0.05).

References

    1. Averous J, Proud CG. When translation meets transformation: the mTOR story. Oncogene 25: 6423–6435, 2006. - PubMed
    1. Baum JI, Layman DK, Freund GG, Rahn KA, Nakamura MT, Yudell BE. A reduced carbohydrate, increased protein diet stabilizes glycemic control and minimizes adipose tissue glucose disposal in rats. J Nutr 136: 1855–1861, 2006. - PubMed
    1. Calbet JA, MacLean DA. Plasma glucagon and insulin responses depend on the rate of appearance of amino acids after ingestion of different protein solutions in humans. J Nutr 132: 2174–2182, 2002. - PubMed
    1. Exton JH The perfused rat liver. Methods Enzymol 39: 25–36, 1975. - PubMed
    1. Feldhoff RC, Taylor JM, Jefferson LS. Synthesis and secretion of rat albumin in vivo, in perfused liver, and in isolated hepatocytes. Effects of hypophysectomy and growth hormone treatment. J Biol Chem 252: 3611–3616, 1977. - PubMed

Publication types

MeSH terms