. 2009 Jun;8(6):1579-88.
doi: 10.1158/1535-7163.MCT-09-0013. Epub 2009 Jun 9.

DZNep is a global histone methylation inhibitor that reactivates developmental genes not silenced by DNA methylation

Affiliations

DZNep is a global histone methylation inhibitor that reactivates developmental genes not silenced by DNA methylation

Tina Branscombe Miranda et al. Mol Cancer Ther. 2009 Jun.

Abstract

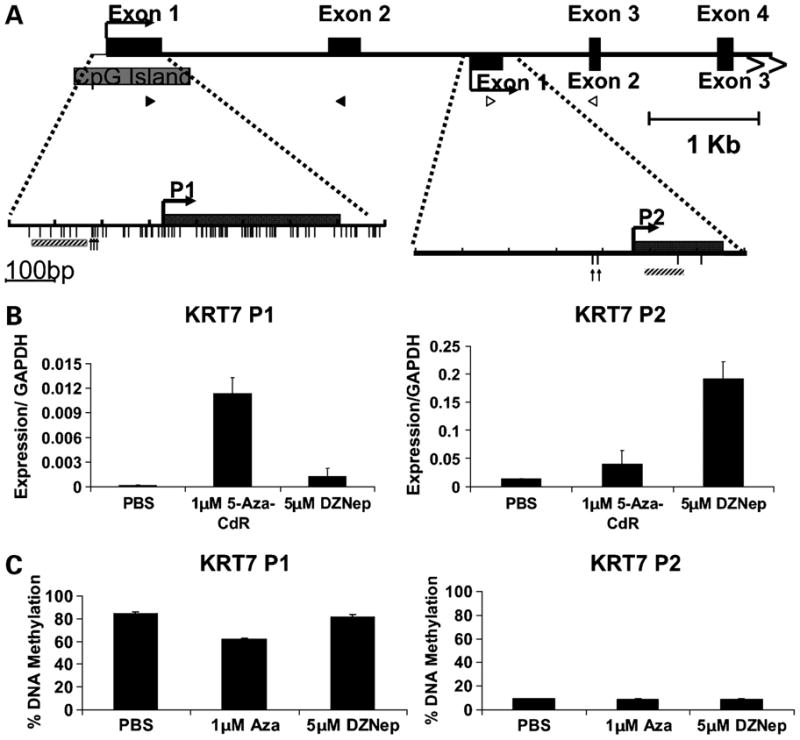
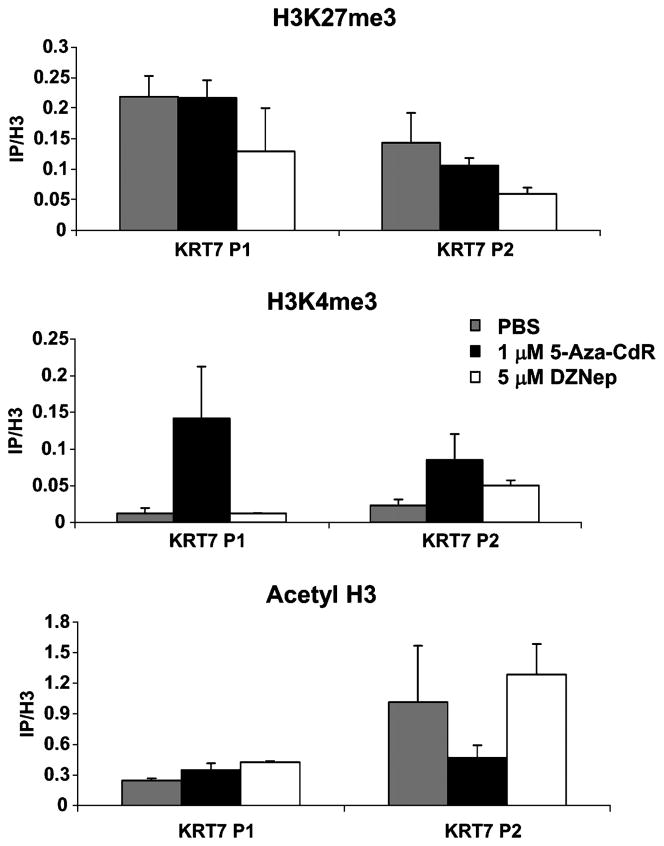
DNA methylation, histone modifications, and nucleosomal occupancy collaborate to cause silencing of tumor-related genes in cancer. The development of drugs that target these processes is therefore important for cancer therapy. Inhibitors of DNA methylation and histone deacetylation have been approved by the Food and Drug Administration for treatment of hematologic malignancies. However, drugs that target other mechanisms still need to be developed. Recently, 3-deazaneplanocin A (DZNep) was reported to selectively inhibit trimethylation of lysine 27 on histone H3 (H3K27me3) and lysine 20 on histone H4 (H4K20me3) as well as reactivate silenced genes in cancer cells. This finding opens the door to the pharmacologic inhibition of histone methylation. We therefore wanted to further study the mechanism of action of DZNep in cancer cells. Western blot analysis shows that DZNep globally inhibits histone methylation and is not selective. Two other drugs, sinefungin and adenosine dialdehyde, have similar effects as DZNep on H3K27me3. Intriguingly, chromatin immunoprecipitation of various histone modifications and microarray analysis show that DZNep acts through a different pathway than 5-aza-2'-deoxycytidine, a DNA methyltransferase inhibitor. These observations give us interesting insight into how chromatin structure affects gene expression. We also determined the kinetics of gene activation to understand if the induced changes were somatically heritable. We found that upon removal of DZNep, gene expression is reduced to its original state. This suggests that there is a homeostatic mechanism that returns the histone modifications to their "ground state" after DZNep treatment. Our data show the strong need for further development of histone methylation inhibitors.


Figures

Figure 1
Figure 1. Methyltransferase inhibitors
A) Chemical structures of DZNep (3-deazaneplanocin), Adox (adenosine-dialdehyde), Sinefungin, and 5-Aza-CdR (5-Aza-2′-deoxycytidine). The enzyme(s) inhibited by each chemical is indicated below the structures in parenthesis. B) Schematic of AdoMet (S-adenosylmethionine) metabolism and its inhibition. AdoMet is the methyl donor for methylation reactions. AdoMet is metabolized to AdoHcy (adenosylhomocysteine) by methyltransferases. AdoHcy is then converted into adenosine and homocysteine by AdoHcy hydrolase. DZNep and Adox inhibit AdoHcy hydrolase causing an increase in AdoHcy levels. AdoHcy in turn inhibits the methyltransferases. Sinefungin directly inhibits methyltransferases.
Figure 2
Figure 2. The effects of methyltransferase inhibitors on global histone methylation
A) MCF7 breast cancer cells and T24 bladder cancer cells were treated with either 1 μM 5-Aza-CdR, 5 or 10 μM DZNep, 150 μM Sinefungin or 50 μM Adox for 72 h. Cells were harvested and DNMT1, EZH2 and H3K27me3 levels were measured by western blot analysis. B) MCF-7 cells were treated with either 1 μM or 5 μM DZNep for 72 h. Cells were harvested and global histone methylation levels were determined by western blot analysis.
Figure 3
Figure 3. The effects of 5-Aza-CdR and DZNep on KRT7 expression
A) 5′ RACE was performed on RNA purified from MCF7 cells treated with either 1 μM 5-Aza-CdR or 5 μM DZNep for 72h. The 5′ RACE results found that 5-Aza-CdR and DZNep turned on different transcripts as depicted in the figure. P1, promoter 1; P2, promoter 2; black boxes, exons; gray box, CpG Island; vertical lines, CpG sites; bent arrows, transcriptional start sites determined by 5′ RACE; vertical arrows, CpG sites analyzed by pyrosequencing; gray hatched squares, ChIP PCR products B) Specific primers were designed toward each transcript. Primer sites are indicated in part A. Black triangles represent the binding sites for the primers specific to the promoter 1 (P1) transcript whereas the white triangles indicate the binding sites for the primers specific to the promoter 2 (P2) transcript. Real time qPCR was used to verify the activation of the different promoters by 5-Aza-CdR and DZNep. Error bars represent the range from two biological repeats. C) MCF7 cells were treated with either 1 μM 5-Aza-CdR or 5 μM DZNep for 72 h. Pyrosequencing was used to analyze the affects within the KRT7 P1 promoter or the KRT7 P2 promoter. Error bars represent the range from two (P1) or three (P2) analyzed sites.
Figure 4
Figure 4. KRT7 P1 and P2 ChIP analyses
ChIP analysis of the KRT7 P1 and P2 locus after treatment of MCF7 cells with either 1μM 5-Aza-CdR or 5μM DZNep for 72h. ChIP analysis for histone H3K27me3, H3K4me3, and acetyl H3. IP’s are normalized to H3 to account for any variation in nucleosome positioning due to the drug treatments. Error bars represent the range between duplicate ChIPs. Figure is a representative of two biological repeats. Each repeat gave similar results.
Figure 5
Figure 5. Illumina expression arrays
A) Scatter plots showing genes that are upregulate or downregulated more than two-fold upon treatment of MCF7 cells treated with either 1 μM 5-Aza-CdR (top) or 5 μM DZNep (bottom) for 72 h when compared to untreated MCF7 cells. Green dots indicate upregulated genes whereas red dot indicate down regulated genes. B) Venn diagram showing the overlap of genes upregulated in MCF7 cells treated with 5-Aza-CdR or DZNep. MCF7 cells were treated with either 1 μM 5-Aza-CdR or 5 μM DZNep for 72 h. Gene expression was analyzed using Illumina human 6 microbead array. C) EASE analysis showing the categories of genes turned on by DZNep or 5-Aza-CdR. The Bonferroni score of less than 1 was determined to be significant.
Figure 6
Figure 6. Comparison of the heritability of gene expression upon treatment of MCF7 cells with either 5-Aza-CdR or DZNep
MCF7 cells were treated with either 1 μM 5-Aza-CdR or 10 μM DZNep for 24 h. Cells were harvested for RNA extraction or for cellular extracts every day for 14 days beginning 24 hr after drug removal (day 1). A) Real time qPCR showing the heritability of KRT7 P1 transcript and KRT7 P2 transcript following drug treatments. B) Western blot showing how the levels of EZH2 change upon drug removal. Bots were analyzed using Fluor-S Multi-ImagerMAX instrument (Bio-Rad, Hercules, CA). C) Genes that were upregulated more than 2-fold by either drug treatment were determined by Illumina microarray. The graph shows the number of genes upregulated on day 1 and day 7 by the indicated drug treatments.

References

    1. Jones PA, Baylin SB. The epigenomics of cancer. Cell. 2007;128:683–92. - PMC - PubMed
    1. Yoo CB, Jones PA. Epigenetic therapy of cancer: past, present, and future. Nat Rev Drug Discov. 2006;5:37–50. - PubMed
    1. Cameron EE, Bachman KE, Myohanen S, Herman JG, Baylin SB. Synergy of demethylation and histone deacetylase inhibition in the re-expressing of genes silenced in cancer. Nat Genet. 1999;21:103–7. - PubMed
    1. Egger G, Aparicio AM, Escobar SG, Jones PA. Inhibition of histone deacetylation does not block resilencing of p16 after 5-aza-2′-deoxycytidine treatments. Cancer Res. 2007;67:346–53. - PubMed
    1. Miranda TB, Jones PA. DNA methylation: the nuts and bolts of repression. J Cell Physiol. 2007;213:384–90. - PubMed

Publication types

MeSH terms