. 2009 Aug 21;284(34):23107-15.
doi: 10.1074/jbc.M109.013862. Epub 2009 Jun 9.

Modulation of TLR2 protein expression by miR-105 in human oral keratinocytes

Affiliations

Modulation of TLR2 protein expression by miR-105 in human oral keratinocytes

Manjunatha R Benakanakere et al. J Biol Chem. .

Abstract

Mammalian biological processes such as inflammation, involve regulation of hundreds of genes controlling onset and termination. MicroRNAs (miRNAs) can translationally repress target mRNAs and regulate innate immune responses. Our model system comprised primary human keratinocytes, which exhibited robust differences in inflammatory cytokine production (interleukin-6 and tumor necrosis factor-alpha) following specific Toll-like receptor 2 and 4 (TLR-2/TLR-4) agonist challenge. We challenged these primary cells with Porphyromonas gingivalis (a Gram-negative bacterium that triggers TLR-2 and TLR-4) and performed miRNA expression profiling. We identified miRNA (miR)-105 as a modulator of TLR-2 protein translation in human gingival keratinocytes. There was a strong inverse correlation between cells that had high cytokine responses following TLR-2 agonist challenge and miR-105 levels. Knock-in and knock-down of miR-105 confirmed this inverse relationship. In silico analysis predicted that miR-105 had complementarity for TLR-2 mRNA, and the luciferase reporter assay verified this. Further understanding of the role of miRNA in host responses may elucidate disease susceptibility and suggest new anti-inflammatory therapeutics.


Figures

FIGURE 1.
FIGURE 1.
Normal and diminished cytokine response cells were challenged with heat-inactivated P. gingivalis (strain 33277) at 100 multiplicity of infection for 24 h, and RNA was miRNA microarray profiled using the miRCURY LNA Array (Exiqon). The heat map shows two-way hierarchical clustering of genes and samples (rows = miRNA, columns = sample). The color scale indicates relative expression: yellow, above mean; blue, below mean; and black, below background. Global microarray expression revealed distinct profiles for 109 miRNAs expressed among these cells (p = 0.05) out of which, 26 well annotated miRNAs revealed distinct patterns (p = 0.0037), and miR-105 is represented with a rectangular dotted box (A). This signal is up-regulated in the diminished cytokine response phenotype after challenging with heat-inactivated P. gingivalis and down-regulated in normal response cells after challenge (p = 0.0017) (B). The stem loop of miR-105 with complimentarity to TLR-2 mRNA and sequence of antagomir used for the present study are shown (C).
FIGURE 2.
FIGURE 2.
TLR-2 gene, IL-6, and TNF-α cytokine expression in both normal type and diminished cytokine response cells. Human gingival keratinocytes were challenged with heat-inactivated P. gingivalis (100 MOI) or FSL-1 (1 μg/ml) for 24 h. Total RNA was isolated for real-time PCR. The TLR-2 receptor mRNA abundance increased upon TLR-2 ligand challenge in normal cells and was unchanged in diminished response cells after challenge (A), compared with control (p < 0.001). An enzyme-linked immunosorbent assay was performed on the supernatants, and IL-6 (B) and TNF-α (C) were found to be up-regulated in normal cells and remained unchanged in diminished response cells after challenge (p < 0.001). Results are mean ± S.D. (n = 3) using the same primary cells. Statistical comparisons are shown by horizontal bars with asterisks above them (*** indicates p < 0.001; NS = no significant difference).
FIGURE 3.
FIGURE 3.
miR-105 and TLR2 expression in normal and diminished cytokine response cells. The cells were subjected to P. gingivalis and FSL-1 treatment for 24 h and quantitated the miR-105 expression and Western blot for TLR-2. Total RNA was amplified with specific miR-105 hairpin loop primers and subjected to real-time PCR. miR-105 up-regulated in diminished cytokine response cells after challenge. The miR-105 expression showed minimal or no change in normal cells (A) (p = 0.05). Three normal and three diminished cell types were compared after P. gingivalis challenge for miR-105 gene expression (B) and TLR-2 protein expression, using Western blot (C) with ratio metric analysis (β-Actin/TLR-2) (D). Statistical comparisons are shown by bars with asterisks above them (* indicates p < 0.05; NS = no significant difference).
FIGURE 4.
FIGURE 4.
The level of TLR-2 protein by Western blot after transfecting miR-105 antagomir. The diminished type cells transfected with miR-105 antagomir up-regulated TLR-2 protein expression upon TLR-2 agonist challenge (A). The ratio metric analysis (β-Actin/TLR-2) of Western blot intensity showing TLR2 protein expression (B). Similarly, IL-6 (C) and TNF-α (D) were up-regulated in diminished cell types when miR-105 antagomir was transfected and challenged either with P. gingivalis or FSL-1. Results are mean ± S.D. (n = 3) representative of two independent experiments. Statistical comparisons are shown by bars with asterisks above them (*** indicates p < 0.001; NS = no significant difference).
FIGURE 5.
FIGURE 5.
The expression of TLR-2in epithelial cells following miR-105 mimic and antagomir transfection. The normal cells were transfected with miR-105 mimic, and diminished cells were transfected with miR-105 antagomir and challenged with FSL-1 (1 μg/ml) for 24 h. Protein (20 μg) was loaded onto each well and detected by anti-TLR-2 antibody for chemiluminescence detection. The normal cells transfected with miR-105 down-regulated TLR-2 protein expression (A), and diminished cell type transfected with miR-105 antagomir up-regulated TLR-2 protein level (B), ratios of Western blot intensity data (β-Actin/TLR2) are represented in C and D, respectively.
FIGURE 6.
FIGURE 6.
Surface expression of TLR-2 in gingival keratinocytes. Normal cells transfected with either miR-105 mimic or antagomir and stained with antiTLR-2 antibody-clone TL2.3 (eBiosciences) with proper Isotype control (Mouse IgG2a). TLR-2 was detected by immunohistochemistry and photographed by confocal microscopy. Control (A), FSL-1-treated cells increased TLR-2 expression (B) miR-105 inhibitor did not affect the surface expression of TLR-2, but the expression was maximized after FSL-1 challenge (C), miR-105 mimic suppressed TLR-2 surface expression even after challenging with FSL-1 as seen by confocal microscopy (D). Bright field overlay with merged SYTO® 83-orange-stained nucleus and Alexa Fluor® 488-stained TLR2 (i), SYTO® 83-orange (ii), Alexa Fluor® 488 (iii), and merged image (iv).
FIGURE 7.
FIGURE 7.
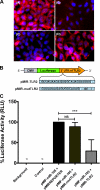
The putative miRNA-105 target site within the 3[prime]-UTR of human TLR-2 mRNA (Ensembl transcript ID: ENST00000260010) and a predicted binding site mutated primers were synthesized, annealed, digested with SpeI and HindIII, and ligated into the multiple cloning site of the pMIRREPORT Luciferase vector. Cultured HEK293 cells with each of these reporter constructs were co-transfected with pMIF-cGFP-Zeo-miR-105 plasmid and assessed for Luciferase expression by confocal microscopy. The positive control had only pMIRREPORTER Luciferase construct (A (A)), The negative control had pMIRREPORTER β-galactosidase co-transfected with pMIF-cGFP-Zeo-miR-105 (A (B)), cells with pMIRREPORTER Luciferase co-transfected with pMIF-cGFP-Zeo-miR-105 plasmid showing decreased Luciferase expression (A (C)), and cells with a mutated vector pMIRREPORTER Luciferase co-transfected with pMIF-cGFP-Zeo-miR-105 vector retained Luciferase expression (A (D)). A Luciferase reporter vector with potential binding site is represented in B. The activity of Luciferase was measured using Luciferase assay kit (Stratagene). The Luciferase activity was significantly down-regulated in cells co-transfected with pMIF-cGFP-Zeo-miR-105 (pMIF-miR-105) and pMIRREPORTER-TLR2 (plasmid containing putative miR-105 binding region of TLR2) but not in cells co-transfected with pMIF-miR-105 and pMIRREPORTER-mutTLR2 (plasmid containing mutated miR-105 binding region of TLR-2) (C). Results are mean ± S.D. of triplicates and are representative of three independent experiments. Statistical comparisons are shown by bars with asterisks above them (** indicates p < 0.01; NS = no significant difference).

References

    1. Akira S., Uematsu S., Takeuchi O. (2006) Cell 124,783–801 - PubMed
    1. Kinane D. F., Shiba H., Stathopoulou P. G., Zhao H., Lappin D. F., Singh A., Eskan M. A., Beckers S., Waigel S., Alpert B., Knudsen T. B. (2006) Genes Immun. 7,190–200 - PubMed
    1. Akira S., Takeda K. (2004) Nat. Rev. Immunol. 4,499–511 - PubMed
    1. Bartel D. P. (2004) Cell 116,281–297 - PubMed
    1. Liew F. Y., Xu D., Brint E. K., O'Neill L. A. (2005) Nat. Rev. Immunol. 5,446–458 - PubMed

Publication types