. 2009 Jul 24;284(30):20206-14.
doi: 10.1074/jbc.M109.021139. Epub 2009 Jun 9.

GAREM, a novel adaptor protein for growth factor receptor-bound protein 2, contributes to cellular transformation through the activation of extracellular signal-regulated kinase signaling

Affiliations

GAREM, a novel adaptor protein for growth factor receptor-bound protein 2, contributes to cellular transformation through the activation of extracellular signal-regulated kinase signaling

Kyoko Tashiro et al. J Biol Chem. .

Abstract

Adaptor proteins for the various growth factor receptors play a crucial role in signal transduction through tyrosine phosphorylation. Several candidates for adaptor proteins with potential effects on the epidermal growth factor (EGF) receptor-mediated signaling pathway have been identified by recent phosphoproteomic studies. Here, we focus on a novel protein, GAREM (Grb2-associated and regulator of Erk/MAPK) as a downstream molecule of the EGF receptor. GAREM is phosphorylated at tyrosine 105 and 453 after EGF stimulation. Grb2 was identified as its binding partner, and the proline-rich motifs of GAREM are recognized by the N- and C-terminal SH3 domains of Grb2. In addition, the tyrosine phosphorylations of GAREM are necessary for its binding to Grb2. Because the amino acid sequence surrounding tyrosine 453 is similar to the immunoreceptor tyrosine-based inhibitory motif, Shp2, a positive regulator of Erk, binds to GAREM in this phosphorylation-dependent manner. Consequently, Erk activation in response to EGF stimulation is regulated by the expression of GAREM in COS-7 and HeLa cells, which occurs independent of the presence of other binding proteins, such as Gab1 and SOS, to the activated EGF receptor. Furthermore, the expression of GAREM has an effect on the transformation activity of cultured cells. Together, these findings suggest that GAREM plays a key role in the ligand-mediated signaling pathway of the EGF receptor and the tumorigenesis of cells.


Figures

FIGURE 1.
FIGURE 1.
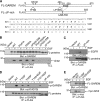
GAREM involvement in the activated EGF receptor complex. A, schematic representation of the primary structure of GAREM. The location of the relevant amino acid residues and a representative tyrosine residue at one end of the sequence are indicated. The location of the proline-rich region is indicated as a shaded box. B, presence of endogenous GAREM in the activated EGF receptor complex. Co-immunoprecipitation experiments were carried out with control IgG and anti-EGF receptor antibody by using HeLa cell lysates with (+) or without (−) EGF stimulation for 10 min. Immunoblot analysis was performed using anti-EGF receptor (upper panel), anti-GAREM (middle panel), and anti-Grb2 antibodies (lower panel). C, EGF stimulation-dependent association of endogenous GAREM and Grb2. Co-immunoprecipitation and immunoblot experiments were carried out using the indicated antibodies and HeLa cell lysates with (+) or without (−) EGF stimulation for 10 min.
FIGURE 2.
FIGURE 2.
The proline-rich motifs in GAREM enable its binding to Grb2; this binding is dependent on the tyrosine phosphorylations of GAREM upon EGF stimulation. A, schematic representation of the constructs of FLAG-tagged wild-type and ΔP-rich GAREM mutants. The positions of the representative tyrosine residues in GAREM and the surrounding amino acid sequence in GAREM are indicated. Numbers indicate amino acid residues (upper). Nucleotide and deduced amino acid sequences of the proline-rich region of GAREM (lower). B, the binding of FLAG-tagged GAREM to endogenous Grb2. Co-immunoprecipitation studies were carried out using the lysates from COS-7 cells transfected with the empty vector or an expression plasmid encoding FLAG-GAREM in which proline (P) residues had been substituted with alanine (A) or deleted (Δ); the number of substituted or deleted amino acid residues substituted or deleted is indicated. Cells were treated with (+) or without (−) EGF stimulation for 10 min, and each FLAG-tagged molecule was immunoprecipitated with the respective anti-FLAG antibody. Immunoblot analysis was performed using anti-GAREM (upper panel) and anti-Grb2 antibodies (lower panel). C, Grb2-dependent association of the EGF receptor and GAREM. COS-7 cells were transfected with the indicated plasmid, and EGF treatment and immunoprecipitation were performed as described above. Immunoblot analysis was carried out using the indicated antibodies (lower panel). D, Tyr-105 and Tyr-453 are tyrosine phosphorylation sites of GAREM that are phosphorylated in an EGF-stimulation dependent manner. COS-7 cells were transfected with each indicated plasmid encoding the FLAG-tagged construct of GAREM derivatives in which tyrosine residues had been substituted with phenylalanine. Immunoprecipitation of the expressed molecule and EGF stimulation of the cells were performed as described above. Immunoblot analysis was carried out using anti-FLAG (lower), and anti-phosphotyrosine (upper) antibodies. E, effects of the tyrosine phosphorylation of GAREM induced by EGF stimulation of the binding of GAREM to Grb2. Co-immunoprecipitation studies were carried out with the anti-FLAG antibody by using the lysates of COS-7 cells transfected with Myc-tagged Grb2 or an expression plasmid of FLAG-GAREM derivatives and EGF treatment. Immunoblot analysis was carried out using the anti-FLAG (upper panel) or anti-Myc antibodies (lower panel).
FIGURE 3.
FIGURE 3.
In vitro interaction between the SH3 and SH2 domains of Grb2 and GAREM was confirmed by GST overlay and pulldown assays. A, schematic representation of the constructs of GST-fused Grb2. Numbers indicate the amino acid residues. B, COS-7 cells were transfected with the expression vectors of FLAG-GAREM or the FLAG-ΔP-rich mutant. Each FLAG-tagged molecule was immunoprecipitated with anti-FLAG antibody. Overlay assays were carried out using GST-Grb2 (upper panel) and GST (middle panel). Immunoblot analysis was performed using anti-FLAG antibody (lower panel). C, GST fusion proteins used in this assay were visualized by Coomassie Brilliant Blue (CBB) staining (bottom panel). Immunoblotting was used to determine the amount of FLAG-GAREM (top panel) and FLAG-ΔP-rich (lower middle panel) bound to GST fusion proteins by using anti-GAREM antibody. The upper middle panel shows the result of subjecting FLAG-GAREM to long exposure times for immunoblotting. The purified protein (1/20th the amount used in this assay) from COS-7 cells expressing FLAG-proteins is present in the left lane. D, in vitro interaction between tyrosine-phosphorylated GAREM and the SH2 domain of Grb2. GST fusion proteins used in this assay were visualized by CBB staining (bottom panel). Immunoblotting analysis of the amounts of FLAG-GAREM and mutant FLAG-GAREM (Y105F and Y453F) bound to the GST fusion proteins was performed using anti-EGFR (top panel) and anti-GAREM (middle panel) antibodies. The total lysate (1/20th the amount used in this assay) from EGF-stimulated COS-7 cells expressing FLAG-proteins is shown in the left lane.
FIGURE 4.
FIGURE 4.
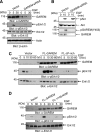
Effect of GAREM expression on Erk activation in response to EGF stimulation. A, effect of siRNA knockdown of GAREM on Erk activation in response to EGF stimulation. The amounts of GAREM (upper), phospho-Erk1/2 (upper middle), Erk1/2 (lower middle), and β-actin (lower) were compared by immunoblotting with each specific antibody. Total cell lysates were prepared using vector-infected (left three lanes) and siRNA construct-infected (right three lanes) HeLa cells stimulated with EGF for the indicated times; 20 μg of each lysate was applied in each lane. B, effects of knockdown of GAREM on phosphorylation, and the activation of Akt in response to EGF stimulation. Total cell lysates were prepared using the vector-infected (left two lanes) and siRNA construct-infected (right two lanes) HeLa cells stimulated with EGF for the indicated times; 20 μg of each lysate was applied in each lane, and immunoblotting analyses were performed using the indicated antibodies. C and D, the amount of each protein was compared by immunoblotting with anti-GAREM (upper panel), anti-phospho-Erk1/2 (middle panel), and anti-Erk1/2 antibodies. Total cell lysates were prepared from COS-7 cells transfected with the empty vector (left lanes in C and D), the expression plasmid for FLAG-GAREM (center lanes in C and D), the ΔP-rich mutant (right lanes in C), or the Y105F/Y453F mutant (right lane in D) and stimulated with EGF for the indicated times; 20 μg of each lysate was applied in each lane.
FIGURE 5.
FIGURE 5.
Binding of Shp2 to GAREM upon EGF stimulation. A, EGF stimulation-dependent association of endogenous GAREM and Shp2. Co-immunoprecipitation experiments were carried out with IgG (control) and anti-GAREM antibody by using the HeLa cell lysates with (+) or without (−) EGF treatment. Immunoblot analysis was performed using anti-GAREM receptor (upper panel) and anti-Shp2 (lower panel). B, Tyr-453 phosphorylation is required for the binding of GAREM to Shp2. COS-7 cells were transfected with a plasmid expressing Myc-Shp2, and each derivative molecule of FLAG-GAREM. Co-immunoprecipitation experiments and EGF stimulation were carried out as described in Fig. 2. Immunoblot analysis was performed using anti-FLAG (upper panel) and anti-Myc (lower panel) antibodies. C and D, effect of co-expression of the dominant negative construct of Shp2 and GAREM on Erk activation in response to EGF stimulation. C, expression of FLAG-GAREM (upper panel) and FLAG-Shp2-(1–220) (lower panel) in COS-7 cells. The amount of each protein was compared by immunoblotting that was performed as described above. D, the amount of each protein was monitored by immunoblotting with anti-phospho-Erk1/2 (upper panel) and anti-Erk1/2 (lower panel) antibodies. Total cell lysates were prepared from COS-7 cells transfected with the indicated expression vectors and stimulated with EGF for the indicated times; 20 μg of each lysate was applied. The levels of Erk phosphorylation were quantified by densitometry and normalized with total Erk. The ratio of Erk phosphorylation to the total Erk present in the cells with the indicated plasmid at time 0 was set as 1. E, GAREM forms a ternary complex with the EGF receptor and Gab1, and the effects of expression of GAREM on the EGF receptor-Gab1 complex are shown. The complex was monitored by immunoprecipitation performed using HeLa cells. EGF-stimulated cells with (+) or without (−) expressing FLAG-GAREM were lysed, and the immunoprecipitation was performed using anti-EGF receptor antibody. Immunoprecipitated EGF receptor (upper panel), co-precipitated Gab1 (middle panel), and GAREM (lower panel) are indicated, respectively. F, effects of knockdown of GAREM on the interaction between SOS and Grb2 in response to EGF stimulation. Immunoprecipitated Grb2 complex prepared from vector-infected (left) and siRNA construct-infected (right) HeLa cells stimulated with EGF was applied in each lane. Immunoblot analysis was carried out using anti-SOS1 (upper panel) and anti-Grb2 (lower panel) antibodies.
FIGURE 6.
FIGURE 6.
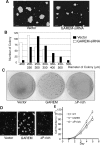
Effects of GAREM expression on growth and transformation of the cultured cells. A, colony formation in soft agar of HeLa cells infected with vector (left panel) and siRNA construct (right panel) was assayed as described under “Experimental Procedures.” B, the graph shows the histogram distribution of the diameter of the colonies of each cell line. The open and solid bars indicate GAREM-siRNA and vector-infected cells, respectively. Data were obtained from 200 randomly selected colonies in one experiment, and three independent sets of experiments were performed. A representative result is shown. C and D, effects of the expression of GAREM on the focus and colony formation of NIH3T3 cells. C, the cell lines of NIH3T3 cells transfected with a vector (left), wild-type GAREM (center), and ΔP-rich mutant (right) were passaged in a growth medium supplemented with 10% calf serum. After 21 days, the cells were fixed and stained with crystal violet. Three independent sets of experiments were carried out, and representative pictures of the focus are shown. D, NIH3T3 cells transfected with vector (left), wild-type GAREM (center), and ΔP-rich mutant (right) were cultured in soft agar for 14 days. Three independent sets of experiments were carried out, and representative pictures of the colonies are shown. The scale bars represent 200 μm. E, NIH3T3 cells transfected with vector (□), wild-type GAREM (○), and ΔP-rich mutant (▵) were seeded onto 6-well plates, and cells were counted at the time points shown. Data are shown as mean ± S.D. of the three experiments.
FIGURE 7.
FIGURE 7.
Expression of the variants of GAREM in various human culture cells and tissues. A, schematic representation of the primary structure of GAREM isoforms. Wild-type GAREM is composed of six exons (gi 12232415), and the truncated forms (GAREM(S)) lack the region from isoleucine 495 to proline 565 (gi 111307706). Numbers indicate amino acid residues of the boundaries. B, expression of GAREM mRNA in various human tissues and cultured cells. Quantitative PCR was carried out using specific internal oligonucleotide primers as indicated in A. The results of studies on various human culture cells (upper panel of top panel set) and tissues (upper panel of bottom panel set) are shown. The amplified DNA fragments of expected size derived from GAREM cDNA are indicated by an arrow in each panel. Glyceraldehyde-3-phosphate dehydrogenase (G3PDH) was used as loading control. The PCR cycle number of all samples was 30. C, the binding property of FLAG-tagged GAREM(S) to Grb2. Co-immunoprecipitation studies were carried out using the cell lysates from COS-7 cells transfected with the empty vector or an expression plasmid encoding FLAG-GAREM or FLAG-GAREM(S). Each FLAG-tagged molecule was immunoprecipitated using anti-FLAG antibody. Immunoblot analysis was carried out using anti-GAREM (upper panel) and anti-Grb2 antibodies (lower panel).

Similar articles

Cited by

References

    1. Pawson T., Nash P. (2003) Science 300, 445–452 - PubMed
    1. Seet B. T., Dikic I., Zhou M. M., Pawson T. (2006) Nat. Rev. Mol. Cell Biol. 7, 473–483 - PubMed
    1. Gu H., Neel B. G. (2003) Trends Cell Biol. 13, 122–130 - PubMed
    1. Liu Y., Rohrschneider L. R. (2002) FEBS Letters 515, 1–7 - PubMed
    1. Nishida K., Hirano T. (2003) Cancer Sci. 27, 4–14 - PMC - PubMed

Publication types

MeSH terms