Using DNA mechanics to predict in vitro nucleosome positions and formation energies
- PMID: 19509309
- PMCID: PMC2724288
- DOI: 10.1093/nar/gkp475
Using DNA mechanics to predict in vitro nucleosome positions and formation energies
Abstract
In eukaryotic genomes, nucleosomes function to compact DNA and to regulate access to it both by simple physical occlusion and by providing the substrate for numerous covalent epigenetic tags. While competition with other DNA-binding factors and action of chromatin remodeling enzymes significantly affect nucleosome formation in vivo, nucleosome positions in vitro are determined by steric exclusion and sequence alone. We have developed a biophysical model, DNABEND, for the sequence dependence of DNA bending energies, and validated it against a collection of in vitro free energies of nucleosome formation and a set of in vitro nucleosome positions mapped at high resolution. We have also made a first ab initio prediction of nucleosomal DNA geometries, and checked its accuracy against the nucleosome crystal structure. We have used DNABEND to design both strong and weak histone- binding sequences, and measured the corresponding free energies of nucleosome formation. We find that DNABEND can successfully predict in vitro nucleosome positions and free energies, providing a physical explanation for the intrinsic sequence dependence of histone-DNA interactions.
Figures


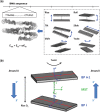
 , where
  , and Eis is the elastic energy change which results from introducing a dinucleotide of type i = 1, … , 16 at position s: Eis = Eis(mut) − Eis(wt). To enforce the 2-fold symmetry of the nucleosome core particle, all dinucleotide energies were symmetrized around the middle of the DNA site, shown as a dashed vertical line. Middle panel: roll angle of the ideal superhelix showing DNA geometry in relation to the histone octamer. Negative roll angles correspond to the minor groove facing the histone surface. (b) Elastic energy components for all possible dinucleotides substituted into the 1kx5 crystal structure at position 109 where the DNA conformation is kinked (Figure 2) (2). Dinucleotides are ranked by their total energy as shown in the legend (best to worst energy from top to bottom). TA is the lowest energy dinucleotide (thick golden line). The energy component analysis reveals that it is the degrees of freedom related to slide (slide–slide and slide–twist components) and roll (roll–roll component) that make the TA dinucleotide most favorable, although the slide–slide component is slightly better in the native CA/TG dinucleotide (red/brown dots). In contrast, the AT dinucleotide (black lines) has the highest energy due to its low flexibility with respect to roll, slide and twist (


Similar articles
-
Structure-based analysis of DNA sequence patterns guiding nucleosome positioning in vitro.J Biomol Struct Dyn. 2010 Jun;27(6):821-41. doi: 10.1080/073911010010524947. J Biomol Struct Dyn. 2010. PMID: 20232936 Free PMC article.
-
DNA sequence-dependent contributions of core histone tails to nucleosome stability: differential effects of acetylation and proteolytic tail removal.Biochemistry. 2000 Apr 4;39(13):3835-41. doi: 10.1021/bi991957l. Biochemistry. 2000. PMID: 10736184
-
Sequence-based prediction of single nucleosome positioning and genome-wide nucleosome occupancy.Proc Natl Acad Sci U S A. 2012 Sep 18;109(38):E2514-22. doi: 10.1073/pnas.1205659109. Epub 2012 Aug 20. Proc Natl Acad Sci U S A. 2012. PMID: 22908247 Free PMC article.
-
Genomic studies and computational predictions of nucleosome positions and formation energies.Adv Protein Chem Struct Biol. 2010;79:1-57. doi: 10.1016/S1876-1623(10)79001-5. Adv Protein Chem Struct Biol. 2010. PMID: 20621280 Review.
-
Twists and turns of the nucleosome: tails without ends.Structure. 1997 Oct 15;5(10):1255-9. doi: 10.1016/s0969-2126(97)00276-1. Structure. 1997. PMID: 9351811 Review.
Cited by
-
Experimental analysis of the mechanism of chromatin remodeling by RNA polymerase II.Methods Enzymol. 2012;512:293-314. doi: 10.1016/B978-0-12-391940-3.00013-5. Methods Enzymol. 2012. PMID: 22910212 Free PMC article.
-
Deciphering the mechanical code of the genome and epigenome.Nat Struct Mol Biol. 2022 Dec;29(12):1178-1187. doi: 10.1038/s41594-022-00877-6. Epub 2022 Dec 5. Nat Struct Mol Biol. 2022. PMID: 36471057 Free PMC article.
-
Poly(dA:dT)-rich DNAs are highly flexible in the context of DNA looping.PLoS One. 2013 Oct 11;8(10):e75799. doi: 10.1371/journal.pone.0075799. eCollection 2013. PLoS One. 2013. PMID: 24146776 Free PMC article.
-
DNA sequence and methylation prescribe the inside-out conformational dynamics and bending energetics of DNA minicircles.Nucleic Acids Res. 2021 Nov 18;49(20):11459-11475. doi: 10.1093/nar/gkab967. Nucleic Acids Res. 2021. PMID: 34718725 Free PMC article.
-
Nucleosome-mediated cooperativity between transcription factors.Proc Natl Acad Sci U S A. 2010 Dec 28;107(52):22534-9. doi: 10.1073/pnas.0913805107. Epub 2010 Dec 13. Proc Natl Acad Sci U S A. 2010. PMID: 21149679 Free PMC article.
References
-
- Khorasanizadeh S. The nucleosome: from genomic organization to genomic regulation. Cell. 2004;116:259–272. - PubMed
-
- Richmond TJ, Davey CA. The structure of DNA in the nucleosome core. Nature. 2003;423:145–150. - PubMed
-
- Boeger H, Griesenbeck J, Strattan JS, Kornberg RD. Nucleosomes unfold completely at a transcriptionally active promoter. Mol. Cell. 2003;11:1587–1598. - PubMed
-
- Wallrath LL, Lu Q, Granok H, Elgin SCR. Architectural variations of inducible eukaryotic promoters: preset and remodeling chromatin structures. Bioessays. 1994;16:165–170. - PubMed

