. 2009 Jul;35(1):57-68.
doi: 10.3892/ijo_00000313.

FoxM1 is a downstream target and marker of HER2 overexpression in breast cancer

Affiliations

FoxM1 is a downstream target and marker of HER2 overexpression in breast cancer

Richard E Francis et al. Int J Oncol. 2009 Jul.

Abstract

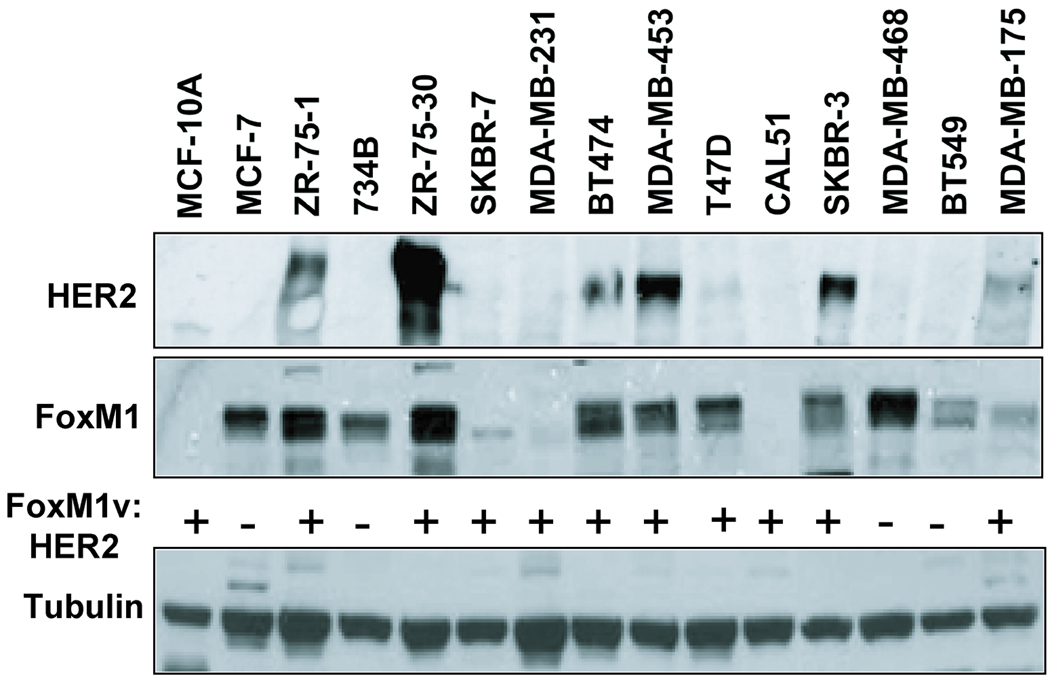
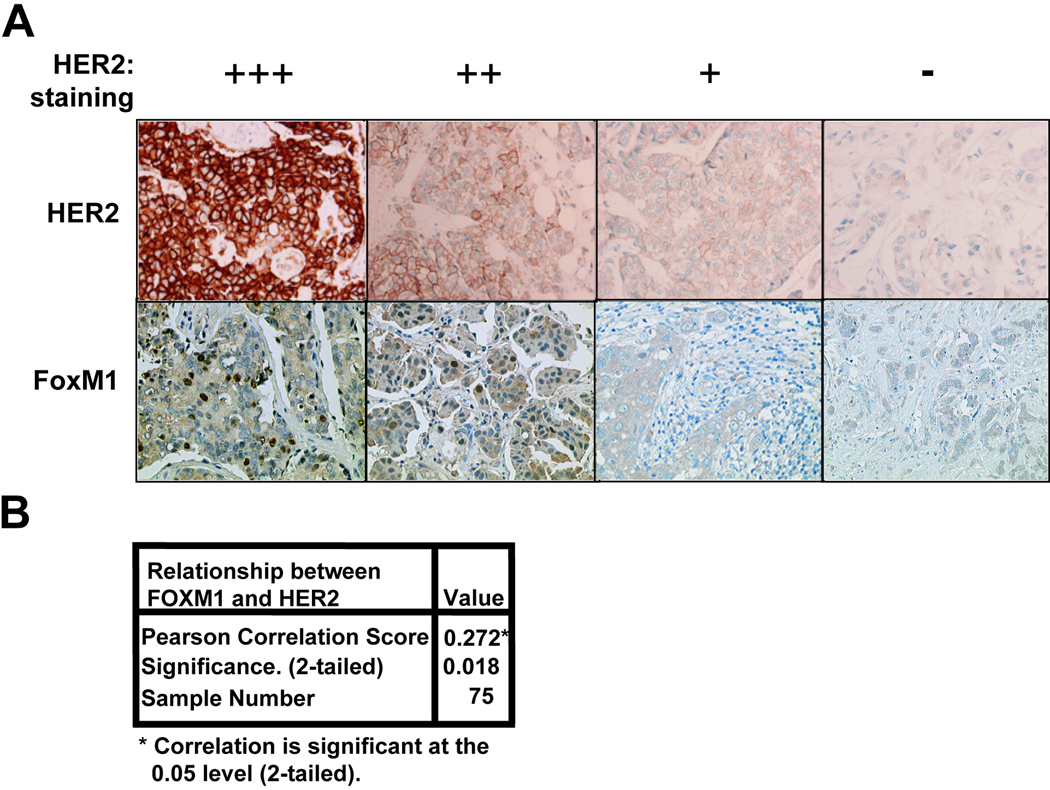
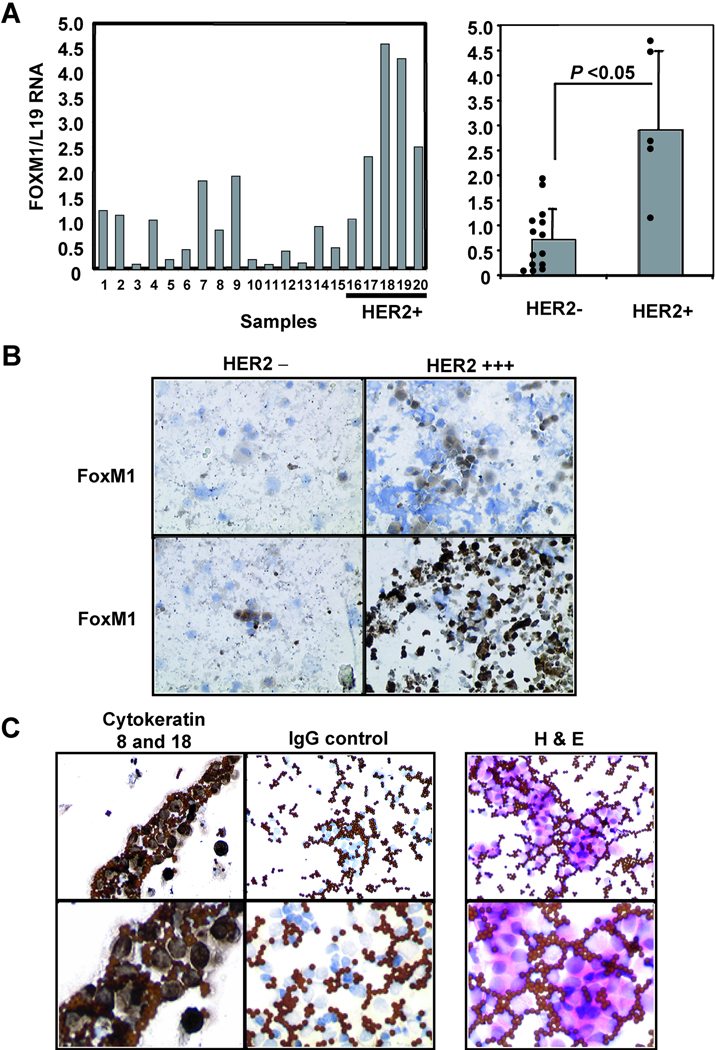
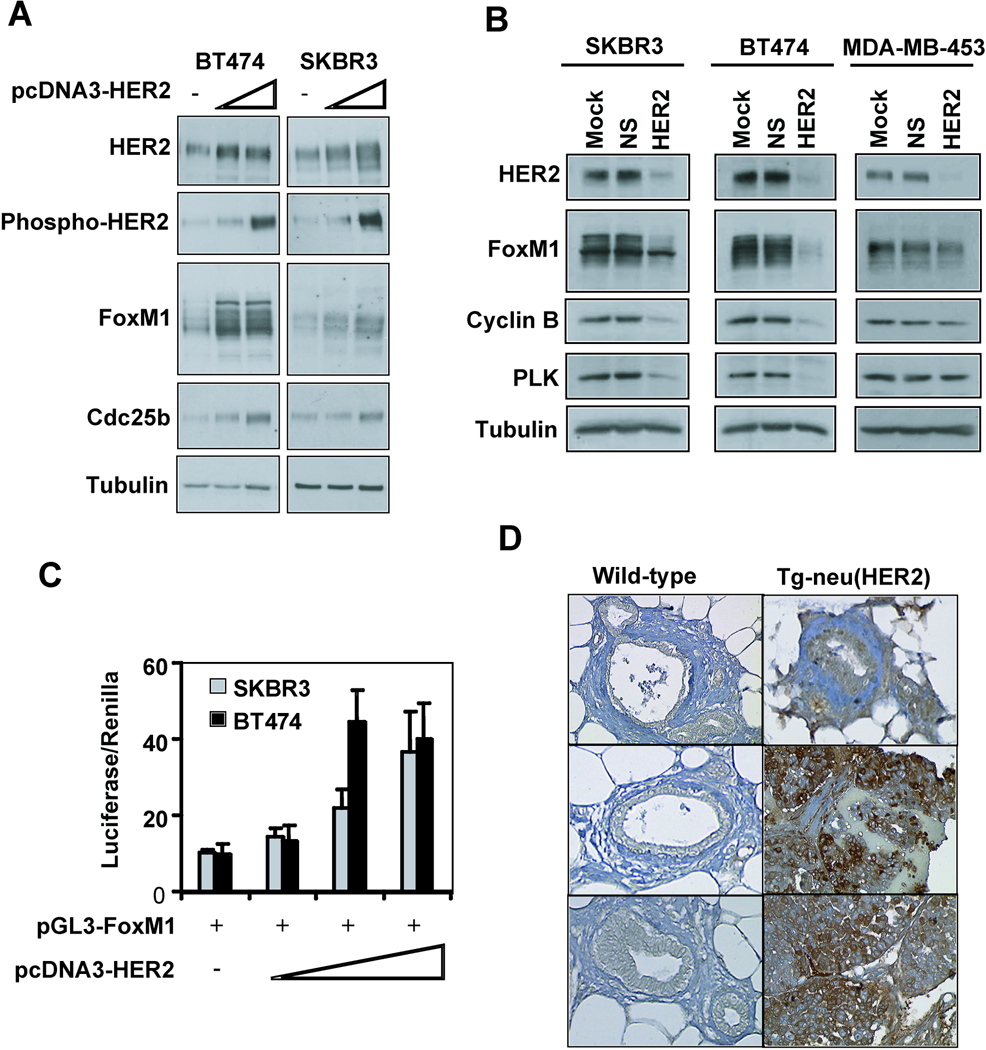
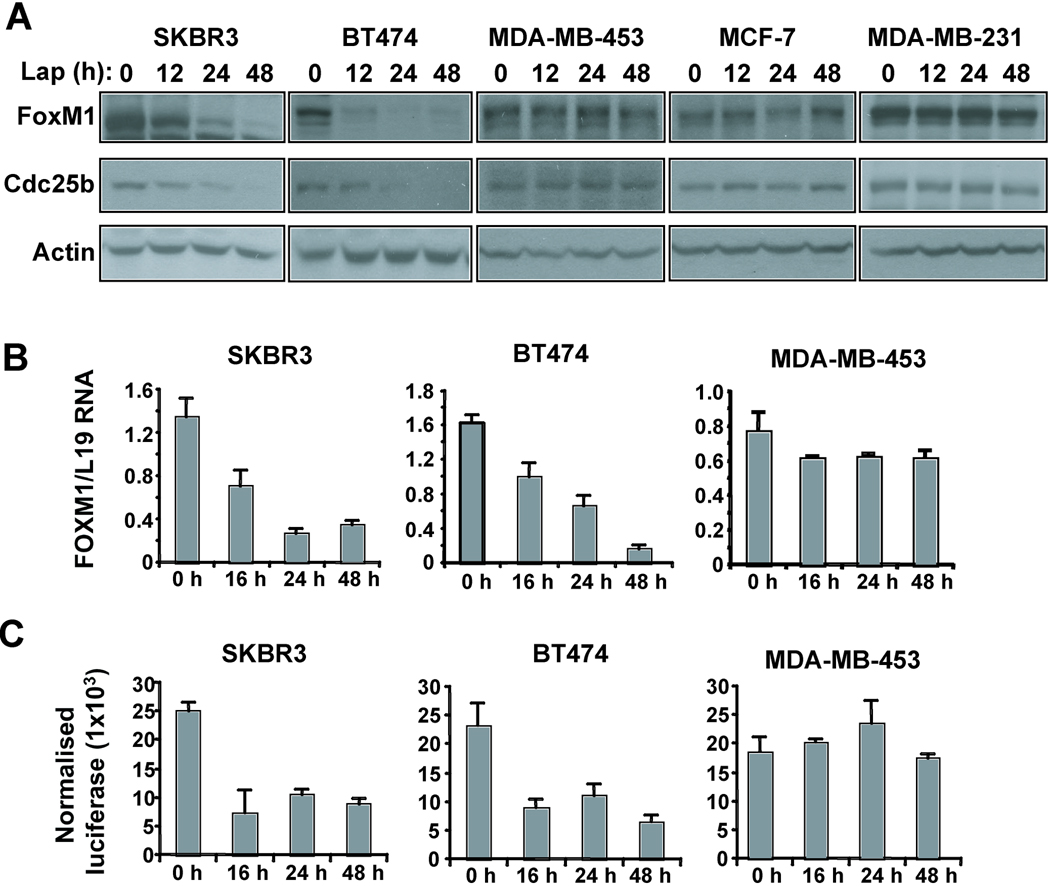
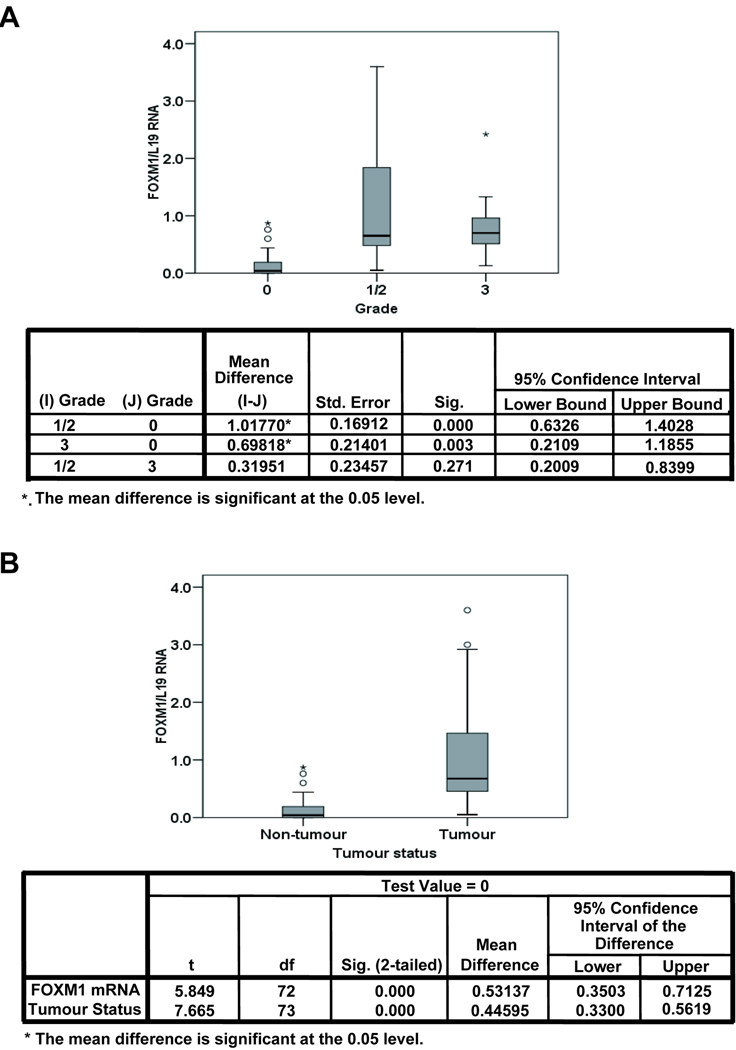
The tyrosine kinase receptor, HER2 is a crucial prognostic marker and therapeutic target for breast cancer; however, the downstream targets and biological effectors of HER2 remain unclear. We investigated the relationship between HER2 and the transcription factor FoxM1 in breast cancer. HER2 and FoxM1 expression levels were compared in breast carcinoma cell lines, paraffin-embedded breast cancer patient samples and at the mRNA level in purified breast epithelial cells. To further examine the relationship between HER2 and FoxM1 expression, we either overexpressed or siRNA-mediated depleted endogenous HER2 in breast cancer cell lines. Additionally, a mammary epithelium-targeted HER2 (neu) transgenic mouse model was also used to assess the effect of HER2 on FoxM1 levels. Furthermore, the effect of the HER2-tyrosine kinase inhibitor lapatinib on FoxM1 in HER2 positive breast cancer cells was investigated. HER2 protein levels directly correlated with FoxM1 expression in both breast carcinoma cell lines and paraffin-embedded breast cancer patient samples. Moreover, in purified breast epithelial cells, overexpression of HER2 was associated with high levels of FoxM1 mRNA, suggesting that the upregulation of FoxM1 expression is at least partially mediated transcriptionally. Furthermore, overexpression or ablation of endogenous HER2 resulted in parallel changes in FoxM1 expression. Critically, mammary epithelium-targeted HER2 mouse tumours also resulted in increased FoxM1 expression, suggesting that HER2 directed FoxM1 expression occurs in vivo and may be a critical downstream effector of HER2-targeting therapies. Indeed, treatment of breast cancer cells with lapatinib reduced FoxM1 expression at protein, mRNA and gene promoter levels. Moreover, analysis of normal and breast cancer patient samples revealed that elevated FoxM1 expression at protein and mRNA levels correlated with breast cancer development, but not significantly with cancer progression and survival. Our results indicate that the HER2 receptor regulates the expression of the FoxM1 transcription factor, which has a role in breast cancer development.


Figures

Figure 1
Figure 1. HER2 correlates with FoxM1 protein expression in breast carcinoma cell lines
Protein lysates were prepared from fifteen different cancer cell lines, as indicated, and 20 µg was analyzed by Western blotting using specific antibodies against HER2 (top panel is a low exposure and bottom panel is a short exposure), FoxM1 and tubulin. + indicates positive correlation, and - denotes no correlation for each cell line.
Figure 2
Figure 2. HER2 protein expression correlates with FoxM1 expression in breast cancer patient samples
(A) Tumour tissue samples obtained from breast cancer patients that had been formalin fixed paraffin-embedded were immunohistochemically stained with HER2 and FoxM1 antibodies using the streptavidin-biotin-peroxidase technique. Examples of four paired samples stained with antibodies against HER2 (left column) and FoxM1 (right column) are shown (X200 magnification). (B) FoxM1 status and HER2 expression was determined by immunohistochemistry as in (A) and categorised as described in material and methods. 112 samples were analysed of which 75 were FoxM1 and HER2 positive, 109 were FoxM1 positive, and 78 HER2 positive. The correlation between FoxM1 status and HER2 expression levels was analysed using a 2-tailed Pearson’s correlation test, and was considered significant at p<0.05.
Figure 3
Figure 3. HER2 expression correlates with FoxM1 expression in cells isolated from breast cancer patients
(A) RNA was isolated from epithelial cells purified from primary tumours and subjected to RTQ-PCR with FoxM1 and L19 primers. The left-hand graph shows the FoxM1/L19 ratio of the 20 tumour samples examined, with the cases positive for HER2 (as determined by FISH) indicated on the right. The right-hand graph illustrates the FoxM1/L19 ratio of the samples after categorising into either HER2 negative or positive. The correlation shown to be significant using the students t-test; errors bars indicated standard deviation, p<0.05. (B) The purified epithelial tumour cells were cytospun and subsequently stained for HER2 and FoxM1 as described above. Examples of staining are shown (X400 magnification). (C) Isolated epithelial tumour cells were validated for purity by staining with hematoxylin/eosin (H&E) and for cytokeratins 8 and 18. Upper panel shows 20X and lower panel shows 40X magnification.
Figure 4
Figure 4. Altering the HER2 expression levels modulates FoxM1 expression breast cancer cells
(A) SKBR3 or BT474 cells were transfected with either 3 µg or 5 µg of pCDNA3-HER2 or empty vector for 48 hours before protein lysate was prepared. Lysate (20 µg) was subjected to Western blotting with the indicated antibodies. (B) SKBR3, BT474 or MDA-MB-453 cells were transfected with mock (transfection reagent alone), 50 nM non-specific siRNA or 50 nM HER2 siRNA for 48 h. Subsequently cells were lysed and proteins (20 µg) analysed by Western blotting with the specified antibodies. (C) SKBR3 or BT474 cells were transfected with 20 ng of the FoxM1 promoter and increasing amounts (0.1, 0.2, 0.25 ng) of the HER2 expression plasmid for 24 hours before cells were collected for luciferase reporter assays. The relative luciferase activity values are corrected for co-transfected renilla activity. All data shown represent the average of three independent experiments, and the error bars show the standard deviation (mean ± SD). (D) Mouse epithelial tissue from either wild-type mammary glands or mammary tissue-overexpressing HER2 was isolated and stained for FoxM1. A total of at least six controls and six MMTV-neu samples were examined and staining from three controls and MMTV-neu samples were shown (X200 magnification).
Figure 5
Figure 5. Treatment of sensitive cells with lapatinib results in reduced FoxM1 expression levels
(A) SKBR3, BT474, MDA-MB-453, MCF-7 or MDA-MB-231 cells were treated with 1µM lapatinib for the indicated time points before protein lysate was prepared. Lysate (20 µg) was subjected to Western blotting with the indicated antibodies. (B) SKBR3, BT474 or MDA-MB-453 cells were treated with 1µM lapatinib for the indicated time points before cells were collected and total RNA isolated. FoxM1 mRNA levels were analysed by RTQ-PCR normalised with L19 mRNA levels. (C) SKBR3, BT474 or MDA-MB-453 cells were transfected with 10 ng of the FoxM1 promoter for 24 h, treated with 1µM lapatinib for the indicated time points before cells were collected for luciferase reporter assays. The relative luciferase activity values are corrected for co-transfected renilla activity. All data shown represent the average of three independent experiments, and the error bars show the standard deviation (mean ± SD).
Figure 6
Figure 6. Relationship between FoxM1 mRNA and tumour grade in breast cancer
The relationship between FoxM1 mRNA and tumour grade was examined. FoxM1 was quantified using RTQ-PCR and normalized using the housekeeping gene L19. 75 individual non-matched patient samples were analysed, of which 41 were non-tumour tissue, 21 samples were from grade 2 classified tumours, and 12 from grade 3 classified tumours. FoxM1/L19 mRNA for grades (A) and for non-tumour versus tumour tissue (B) are shown using Box-and-Whisker plots illustrating the median values, first and third quartile, and smallest and largest values of FoxM1/L19 mRNA at each grade. To test for differences between tumour grade and FoxM1/L19 mRNA one-way-analysis of variance (ANOVA) was performed followed by Dunnett’s t-test, and the mean difference considered significant at the p<0.05 level (A).

References

    1. Zhang H, Berezov A, Wang Q, Zhang G, Drebin J, Murali R, Greene MI. ErbB receptors: from oncogenes to targeted cancer therapies. J Clin Invest. 2007;117:2051–2058. - PMC - PubMed
    1. Yarden Y, Sliwkowski MX. Untangling the ErbB signalling network. Nat Rev Mol Cell Biol. 2001;2:127–137. - PubMed
    1. Slamon DJ, Clark GM, Wong SG, Levin WJ, Ullrich A, McGuire WL. Human breast cancer: correlation of relapse and survival with amplification of the HER-2/neu oncogene. Science. 1987;235:177–182. - PubMed
    1. van de Vijver M, van de Bersselaar R, Devilee P, Cornelisse C, Peterse J, Nusse R. Amplification of the neu (c-erbB-2) oncogene in human mammmary tumors is relatively frequent and is often accompanied by amplification of the linked c-erbA oncogene. Mol Cell Biol. 1987;7:2019–2023. - PMC - PubMed
    1. Varley JM, Swallow JE, Brammar WJ, Whittaker JL, Walker RA. Alterations to either c-erbB-2(neu) or c-myc proto-oncogenes in breast carcinomas correlate with poor short-term prognosis. Oncogene. 1987;1:423–430. - PubMed

Publication types

MeSH terms