

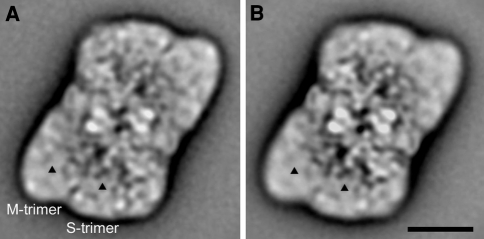
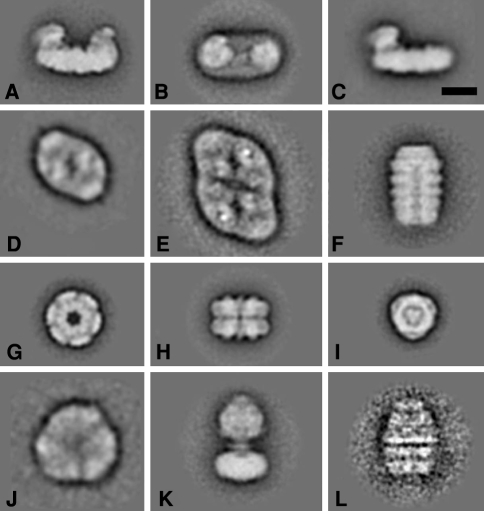
Single particle electron microscopy
- PMID: 19513809
- PMCID: PMC2777225
- DOI: 10.1007/s11120-009-9443-1
Single particle electron microscopy
Abstract
Electron microscopy (EM) in combination with image analysis is a powerful technique to study protein structures at low, medium, and high resolution. Since electron micrographs of biological objects are very noisy, improvement of the signal-to-noise ratio by image processing is an integral part of EM, and this is performed by averaging large numbers of individual projections. Averaging procedures can be divided into crystallographic and non-crystallographic methods. The crystallographic averaging method, based on two-dimensional (2D) crystals of (membrane) proteins, yielded in solving atomic protein structures in the last century. More recently, single particle analysis could be extended to solve atomic structures as well. It is a suitable method for large proteins, viruses, and proteins that are difficult to crystallize. Because it is also a fast method to reveal the low-to-medium resolution structures, the impact of its application is growing rapidly. Technical aspects, results, and possibilities are presented.
© The Author(s) 2009. This article is published with open access at Springerlink.com
Figures
Similar articles
-
Imaging of organelles by electron microscopy reveals protein-protein interactions in mitochondria and chloroplasts.FEBS Lett. 2010 Jun 18;584(12):2510-5. doi: 10.1016/j.febslet.2010.03.027. Epub 2010 Mar 19. FEBS Lett. 2010. PMID: 20303958 Review.
-
The advent of near-atomic resolution in single-particle electron microscopy.Annu Rev Biochem. 2009;78:723-42. doi: 10.1146/annurev.biochem.78.070507.140543. Annu Rev Biochem. 2009. PMID: 19489732 Review.
-
Single-Particle Electron Microscopy Analysis of DNA Repair Complexes.Methods Enzymol. 2017;592:159-186. doi: 10.1016/bs.mie.2017.03.010. Epub 2017 May 8. Methods Enzymol. 2017. PMID: 28668120 Review.
-
Determining the structure of biological macromolecules by transmission electron microscopy, single particle analysis and 3D reconstruction.Prog Biophys Mol Biol. 2001;75(3):121-64. doi: 10.1016/s0079-6107(01)00004-9. Prog Biophys Mol Biol. 2001. PMID: 11376797 Review.
-
Single particle electron microscopy in combination with mass spectrometry to investigate novel complexes of membrane proteins.J Struct Biol. 2005 Mar;149(3):325-31. doi: 10.1016/j.jsb.2004.12.002. J Struct Biol. 2005. PMID: 15721586
Cited by
-
Molecular Mechanisms of Photoadaptation of Photosystem I Supercomplex from an Evolutionary Cyanobacterial/Algal Intermediate.Plant Physiol. 2018 Feb;176(2):1433-1451. doi: 10.1104/pp.17.01022. Epub 2017 Nov 29. Plant Physiol. 2018. PMID: 29187568 Free PMC article.
-
The Assembly of Super-Complexes in the Plant Chloroplast.Biomolecules. 2021 Dec 7;11(12):1839. doi: 10.3390/biom11121839. Biomolecules. 2021. PMID: 34944483 Free PMC article. Review.
-
Conservation of core complex subunits shaped the structure and function of photosystem I in the secondary endosymbiont alga Nannochloropsis gaditana.New Phytol. 2017 Jan;213(2):714-726. doi: 10.1111/nph.14156. Epub 2016 Sep 13. New Phytol. 2017. PMID: 27620972 Free PMC article.
-
Out with the old and in with the new: rapid specimen preparation procedures for electron microscopy of sectioned biological material.Protoplasma. 2014 Mar;251(2):429-48. doi: 10.1007/s00709-013-0575-y. Epub 2013 Nov 21. Protoplasma. 2014. PMID: 24258967 Review.
-
Introduction to imaging methods in photosynthesis.Photosynth Res. 2009 Nov-Dec;102(2-3):107-9. doi: 10.1007/s11120-009-9488-1. Epub 2009 Sep 8. Photosynth Res. 2009. PMID: 19757143 Free PMC article. No abstract available.
References
-
- Boekema EJ. Negative staining of integral membrane proteins. Micron Microsc Acta. 1991;22:361–369. doi: 10.1016/0739-6260(91)90054-4. - DOI
Publication types
MeSH terms
Substances
LinkOut - more resources
Full Text Sources
