. 2009 Jul 1;81(13):5517-23.
doi: 10.1021/ac9008463.

Microfluidic single-cell array cytometry for the analysis of tumor apoptosis

Affiliations

Microfluidic single-cell array cytometry for the analysis of tumor apoptosis

Donald Wlodkowic et al. Anal Chem. .

Abstract

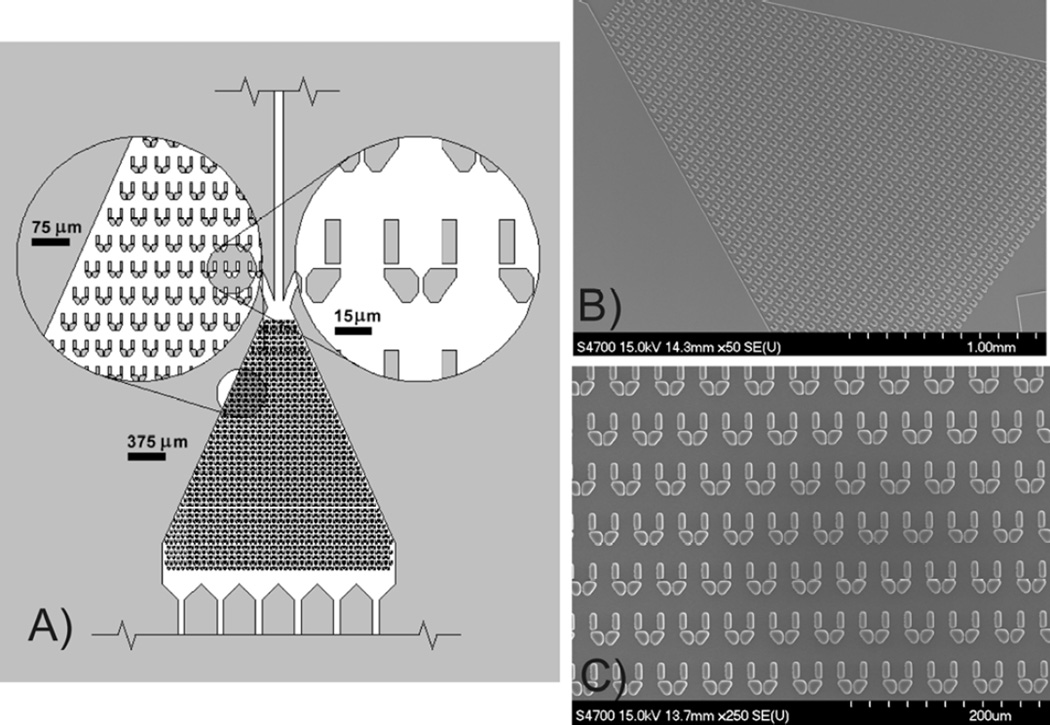
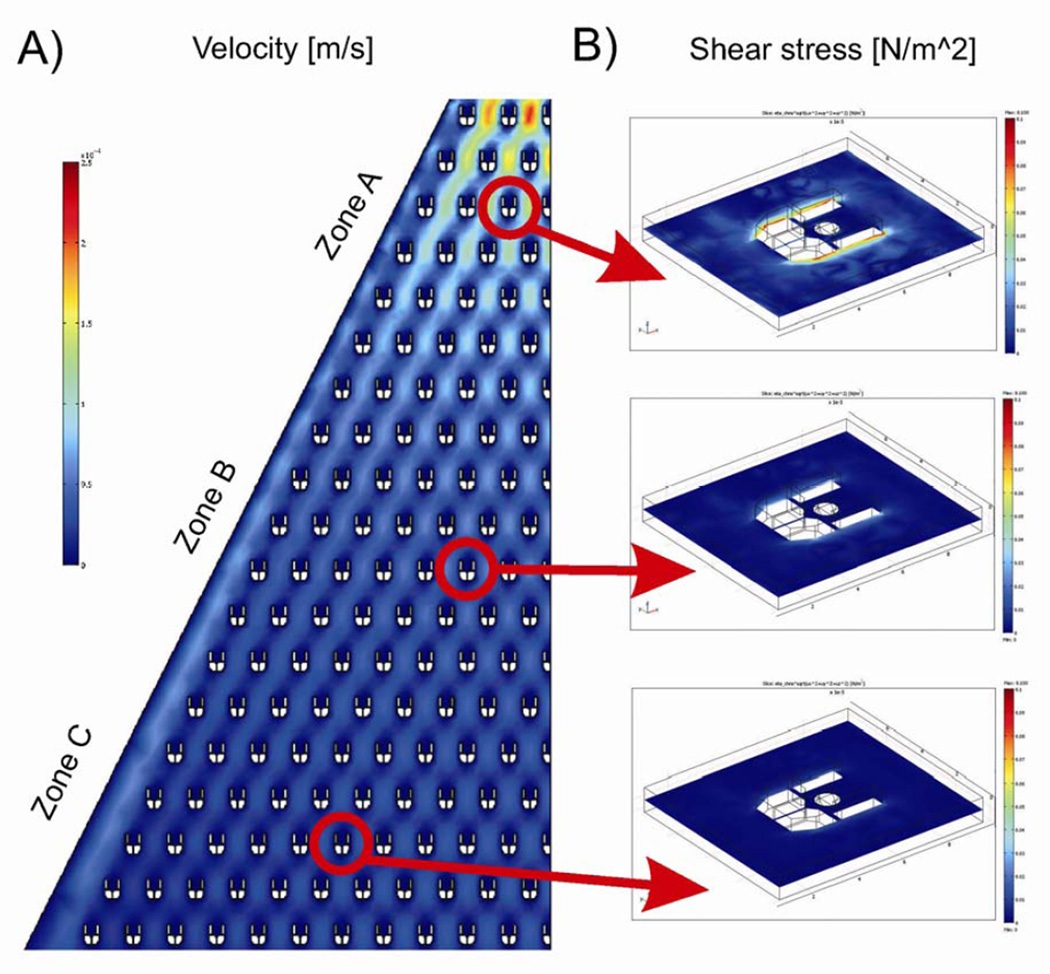
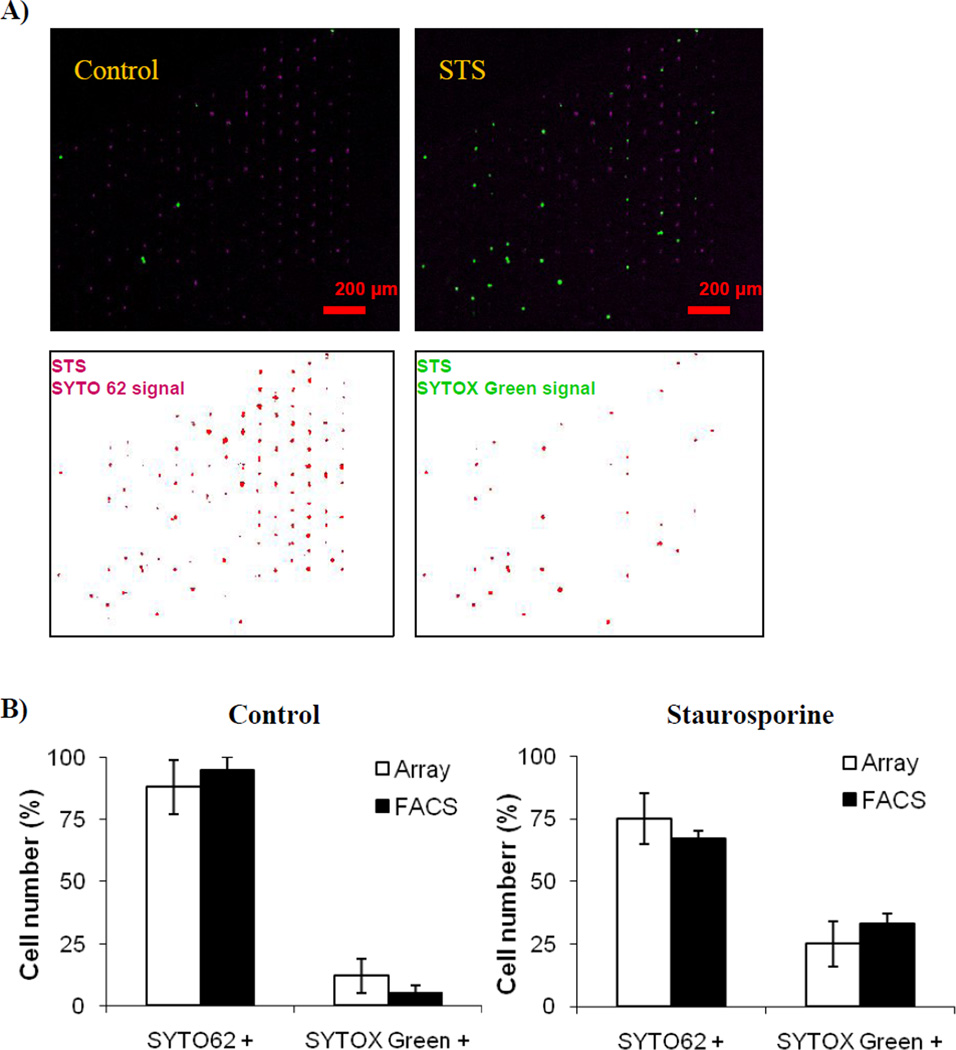
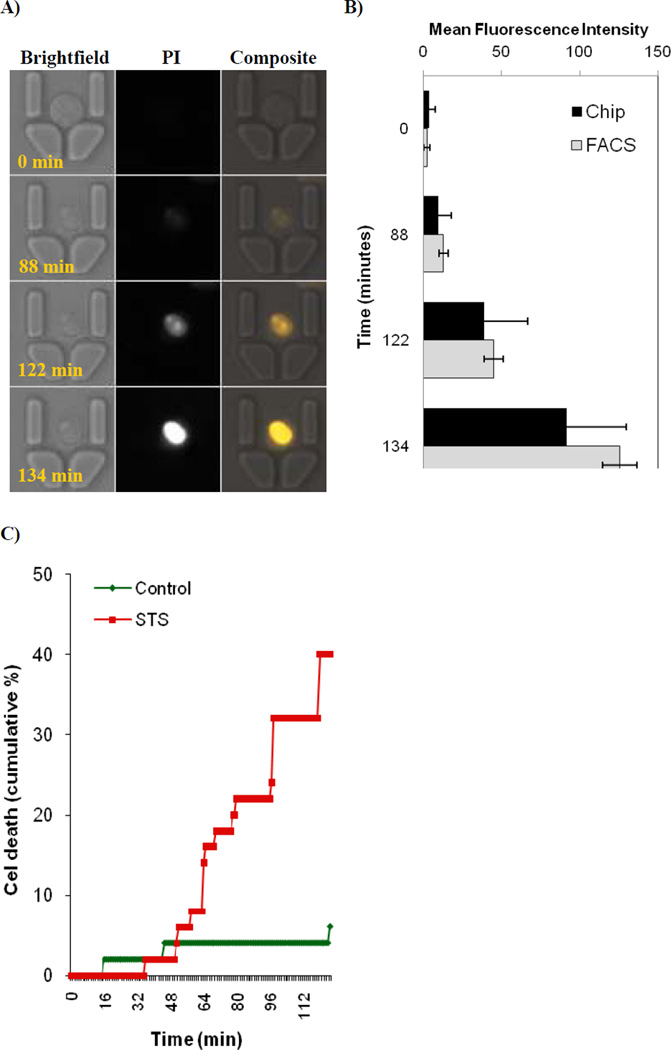
Limitations imposed by conventional analytical technologies for cell biology, such as flow cytometry or microplate imaging, are often prohibitive for the kinetic analysis of single-cell responses to therapeutic compounds. In this paper, we describe the application of a microfluidic array to the real-time screening of anticancer drugs against arrays of single cells. The microfluidic platform comprises an array of micromechanical traps, designed to passively corral individual nonadherent cells. This platform, fabricated in the biologically compatible elastomer poly(dimethylsiloxane), PDMS, enables hydrodynamic trapping of cells in low shear stress zones, enabling time-lapse studies of nonadherent hematopoietic cells. Results indicate that these live-cell, microfluidic microarrays can be readily applied to kinetic analysis of investigational anticancer agents in hematopoietic cancer cells, providing new opportunities for automated microarray cytometry and higher-throughput screening. We also demonstrate the ability to quantify on-chip the anticancer drug induced apoptosis. Specifically, we show that with small numbers of trapped cells (approximately 300) under careful serial observation we can achieve results with only slightly greater statistical spread than can be obtained with single-pass flow cytometer measurements of 15,000-30,000 cells.


Figures

Figure 1
Figure 1
Microfluidic live-cell array (Array Cytometer). A) CAD schematic of chip layout showing a triangular microculture chamber, containing cell trapping array. B–C) SEM images of the array of PDMS cell traps.
Figure 2
Figure 2
Computational modelling of hydrodynamic conditions inside microculture chamber. A) A 2D computer model of the flow velocity. Because of the shape of the overall device, the fluid flow velocity decreases nonlinearly towards the outlet with a substantial drop after first ten rows of traps. In all cases, the regions inside the traps are characterized by a velocity field much lower than in the remaining area of the microchamber. B) 3D simulation results of the shear stress exerted on a trapped cell in three sections of the chip: high velocity (zone A), medium velocity (zone B) and low velocity (zone C). All scale bars have been set to the same limits.
Figure 3
Figure 3
On-chip analysis of drug induced apoptosis. Human HL-60 cells were perfused with 2 µM of Staurosporine (STS) for 2 hours in the presence of apoptosis marker SYTO 62 and plasma membrane permeability marker SYTOX Green. A) On-chip quantification of apoptosis using SYTO 62 and SYTOX Green. Composite images were collected at time 0 and 2 hours (upper panels). Automated chip analysis for STS treated samples is shown in lower panels. B) Quantification and comparison of data obtained by array chip and conventional flow cytometer. Parallel samples were separately analyzed using either conventional flow cytometer (BD FACS Calibur, BD Biosciences) or microfluidic cell array. Note excellent correlation between results from these two technologically dissimilar platforms (R2 ≥ 0.85; p < 0.05 for Pearson and Lee linear correlation test).
Figure 4
Figure 4
Dynamic analysis of drug induced cytotoxicity using microfluidic cell array. Human HL-60 cells were perfused with 2 µM of Staurosporine for up to 3 hours in the presence of plasma membrane permeability marker propidium iodide (PI). Time-lapse images were collected every minute. Note the stochastic nature of anti-cancer drug action. A) Typical time-resolved images of an HL-60 cell undergoing apoptosis after perfusion with Staurosporine, with time points indicated at the lower left corner. Note the gradual increase in plasma membrane permeability to PI that represents initial destabilization of plasma membrane structure during apoptosis. B) Comparison between mean fluorescence intensity distributions achieved by both chip imaging and flow cytometry (FACS). Note higher SD values obtained by cell imaging as compared to FACS. C) Quantification of results from time-lapse images. Results represent cumulative percentage from two independent chips where a total of 250 cells were analysed. Note the stochastic nature of cell death.

References

    1. Martin RM, Leonhardt H, Cardoso MC. Cytometry A. 2005;67A:45–52. - PubMed
    1. Wlodkowic D, Skommer J, Darzynkiewicz Z. Cytometry A. 2008;73:496–507. - PubMed
    1. Andersson H, van den Berg A. Curr Opin Biotechnol. 2004;15:44–49. - PubMed
    1. Di Carlo D, Wu LY, Lee LP. Lab Chip. 2006;6:1445–1449. - PubMed
    1. Svahn HA, van den Berg A. Lab Chip. 2007;7:544–546. - PubMed

Publication types