

Using two chemical exchange saturation transfer magnetic resonance imaging contrast agents for molecular imaging studies
- PMID: 19514717
- PMCID: PMC6010180
- DOI: 10.1021/ar8002738
Using two chemical exchange saturation transfer magnetic resonance imaging contrast agents for molecular imaging studies
Abstract
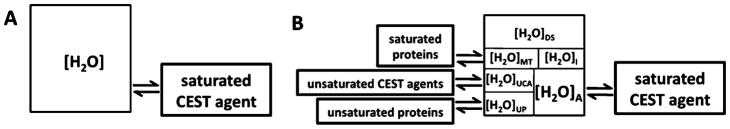
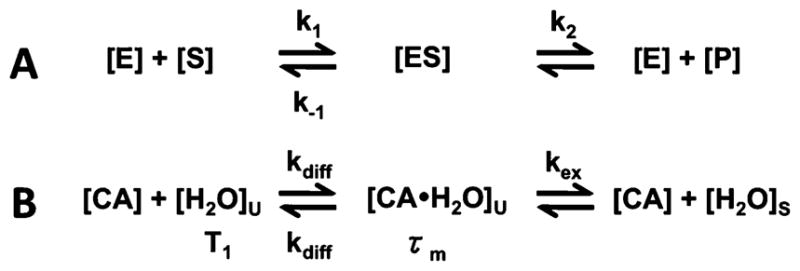
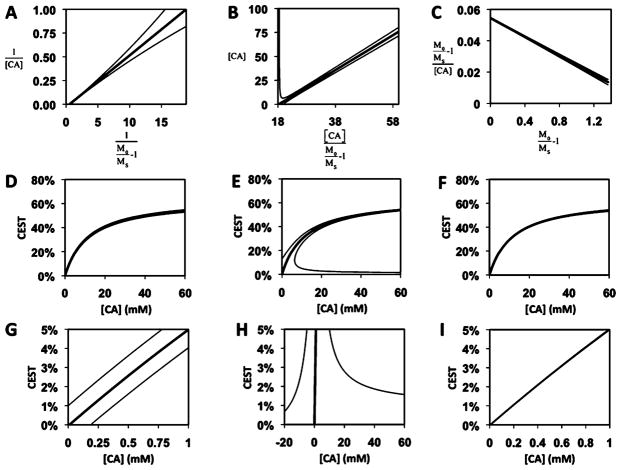
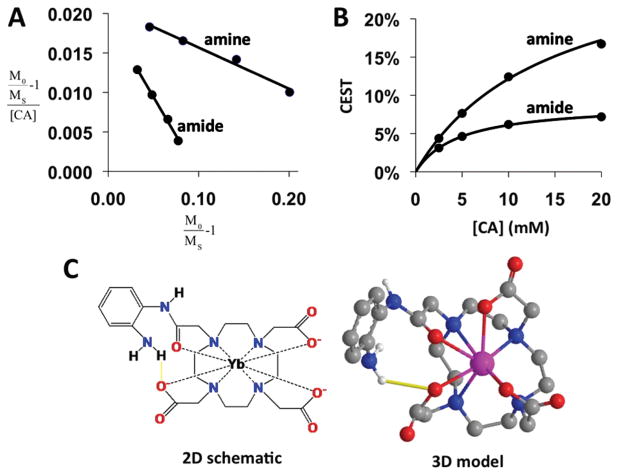
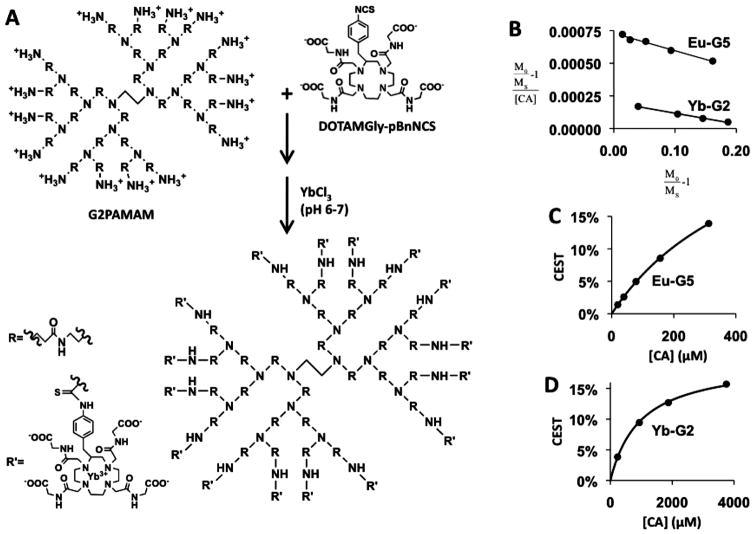
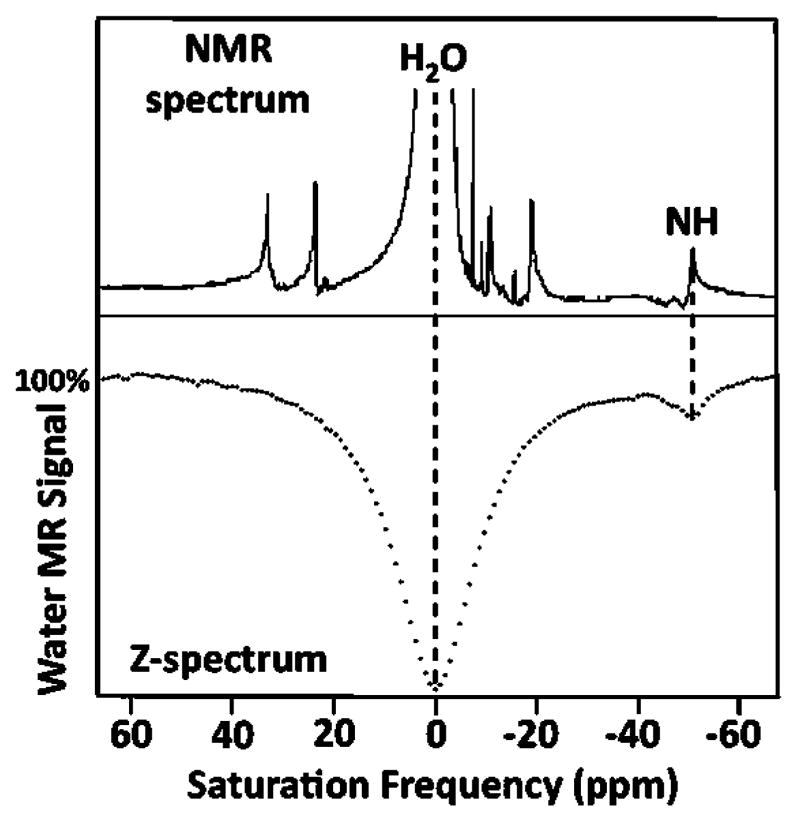
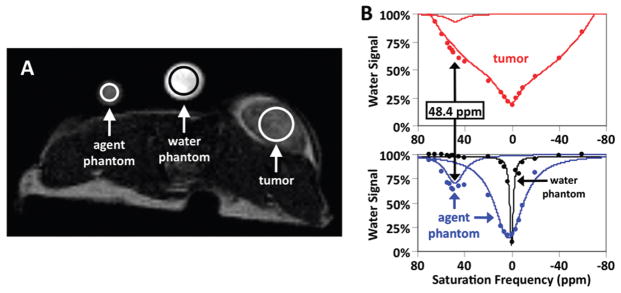
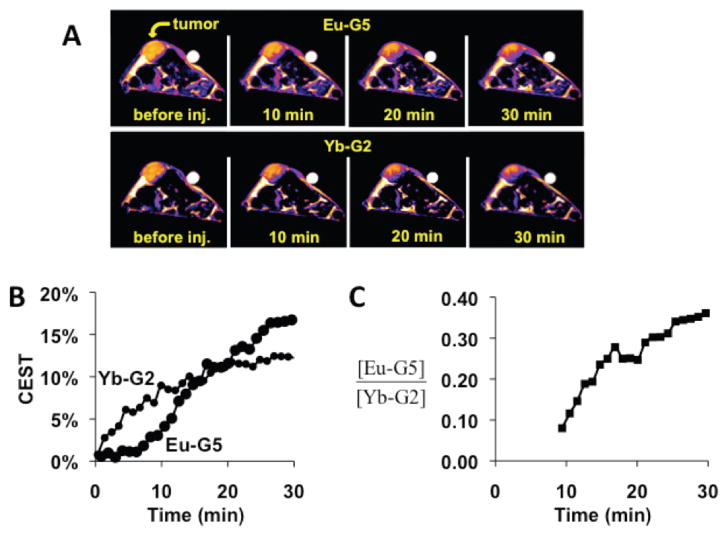
Responsive magnetic resonance imaging (MRI) contrast agents can change MR image contrast in response to a molecular biomarker. Quantitative detection of the biomarker requires an accounting of the other effects that may alter MR image contrast, such as a change in the agent's concentration, magnetic field variations, and hardware sensitivity profiles. A second unresponsive MRI contrast agent may serve as an "internal control" to isolate the detection of the molecular biomarker. Chemical exchange saturation transfer (CEST) MRI contrast agents can be selectively detected, providing the opportunity to combine a responsive CEST agent and an unresponsive CEST agent during the same MRI scan session. When two CEST MRI contrast agents are used for molecular imaging applications, the CEST agents should be designed to maximize accurate quantification of the concentrations of the two agents. From a chemical perspective, CEST agents behave like enzymes that catalyze the conversion of an unsaturated water "substrate" into a saturated water "product". The analysis of CEST agent kinetics parallels the Michaelis-Menten analysis of enzyme kinetics, which can be used to correlate the CEST effect with the concentration of the agent in solution. If the concentration of water "substrate" that is available to the CEST agent is unknown, which may be likely for in vivo MRI studies, then only a ratio of concentrations of the two CEST agents can be measured. In both cases, CEST agents should be designed with minimal T(1) relaxivity to improve concentration quantifications. CEST agents can also be designed to maximize sensitivity. This may be accomplished by incorporating many CEST agents within nanoparticles to create a large number of exchangeable protons per nanoparticle. Finally, CEST agents can be designed with rapid detection in mind. This may be accomplished by minimizing T(1) relaxivity of the CEST agent so that MRI acquisition methods have time to collect many MRI signals following a single selective saturation period. In this Account, we provide an example that shows the sensitive and rapid detection of two CEST agents in an in vivo MRI study of a mouse model of mammary carcinoma. The ratio of the concentrations of the two CEST agents was quantified with analysis methods that parallel Michaelis-Menten enzyme kinetic analysis. This example demonstrates current limitations of the method that require additional research, but it also shows that two CEST MRI contrast agents can be detected and quantitatively assessed during in vivo molecular imaging studies.
Figures
Similar articles
-
A review of optimization and quantification techniques for chemical exchange saturation transfer MRI toward sensitive in vivo imaging.Contrast Media Mol Imaging. 2015 May-Jun;10(3):163-178. doi: 10.1002/cmmi.1628. Epub 2015 Jan 12. Contrast Media Mol Imaging. 2015. PMID: 25641791 Free PMC article. Review.
-
Ytterbium chelated to 1,4,7,10-tetraazacyclododecane-1,4,7-triacetic acid,10-orthoaminoanilide.2011 Nov 26 [updated 2012 Jan 5]. In: Molecular Imaging and Contrast Agent Database (MICAD) [Internet]. Bethesda (MD): National Center for Biotechnology Information (US); 2004–2013. 2011 Nov 26 [updated 2012 Jan 5]. In: Molecular Imaging and Contrast Agent Database (MICAD) [Internet]. Bethesda (MD): National Center for Biotechnology Information (US); 2004–2013. PMID: 22238803 Free Books & Documents. Review.
-
Pushing the sensitivity envelope of lanthanide-based magnetic resonance imaging (MRI) contrast agents for molecular imaging applications.Acc Chem Res. 2009 Jul 21;42(7):822-31. doi: 10.1021/ar800192p. Acc Chem Res. 2009. PMID: 19534516 Review.
-
Measuring in vivo tumor pHe with CEST-FISP MRI.Magn Reson Med. 2012 Mar;67(3):760-8. doi: 10.1002/mrm.23038. Epub 2011 Oct 25. Magn Reson Med. 2012. PMID: 22028287 Free PMC article.
-
Lanthanide(III) complexes that contain a self-immolative arm: potential enzyme responsive contrast agents for magnetic resonance imaging.Chemistry. 2012 Jan 27;18(5):1408-18. doi: 10.1002/chem.201101779. Epub 2011 Dec 28. Chemistry. 2012. PMID: 22213022
Cited by
-
A review of optimization and quantification techniques for chemical exchange saturation transfer MRI toward sensitive in vivo imaging.Contrast Media Mol Imaging. 2015 May-Jun;10(3):163-178. doi: 10.1002/cmmi.1628. Epub 2015 Jan 12. Contrast Media Mol Imaging. 2015. PMID: 25641791 Free PMC article. Review.
-
Lanthanide DO3A-Complexes Bearing Peptide Substrates: The Effect of Peptidic Side Chains on Metal Coordination and Relaxivity.Molecules. 2021 Apr 9;26(8):2176. doi: 10.3390/molecules26082176. Molecules. 2021. PMID: 33918899 Free PMC article.
-
Double agents and secret agents: the emerging fields of exogenous chemical exchange saturation transfer and T2-exchange magnetic resonance imaging contrast agents for molecular imaging.Res Rep Nucl Med. 2015;5:19-32. doi: 10.2147/RRNM.S81742. Res Rep Nucl Med. 2015. PMID: 27747191 Free PMC article.
-
Detection of rapidly exchanging compounds using on-resonance frequency-labeled exchange (FLEX) transfer.Magn Reson Med. 2012 Oct;68(4):1048-55. doi: 10.1002/mrm.24420. Epub 2012 Jul 26. Magn Reson Med. 2012. PMID: 22837066 Free PMC article.
-
Responsive paramagnetic chemical exchange saturation transfer MRI contrast agents.Imaging Med. 2011;3(4):377-380. doi: 10.2217/IIM.11.29. Imaging Med. 2011. PMID: 30854026 Free PMC article.
References
-
- Yoo B, Pagel MD. An overview of responsive MRI contrast agents for molecular imaging. Front Biosci. 2008;13:1733–1752. - PubMed
-
- Zhang X, Martinez GV, Garcia-Martin ML, Woods M, Sherry AD, Gillies RJ. In vivo pHe measurement with a relaxometric pH sensitive contrast agent. Proc World Mol Imaging Congr. 2008:0481.
-
- Aime S, Fedeli F, Sanino A, Terreno E. A R2/R1 ratiometric procedure for a concentration-independent, pH-responsive, Gd(III)-Based MRI agent. J Am Chem Soc. 2006;128(35):11326–11327. - PubMed
-
- Ward KM, Aletras AH, Balaban RS. A new class of contrast agents for MRI based on proton chemical exchange dependent saturation transfer (CEST) J Magn Reson. 2000;143:79–87. - PubMed
-
- Zhang S, Michaudet L, Burgess S, Sherry AD. The amide protons of an ytterbium(III) dota tetraamide complex act as efficient antennae for transfer of magnetization to bulk water. Angew Chem, Int Ed. 2002;41(11):1919–1921. - PubMed
MeSH terms
Substances
Grants and funding
LinkOut - more resources
Full Text Sources
Other Literature Sources
Medical
