Review
. 2009 Jun;44(2-3):117-41.
doi: 10.1080/10409230902858785.

How eukaryotic genes are transcribed

Affiliations
Review

How eukaryotic genes are transcribed

Bryan J Venters et al. Crit Rev Biochem Mol Biol. 2009 Jun.

Abstract

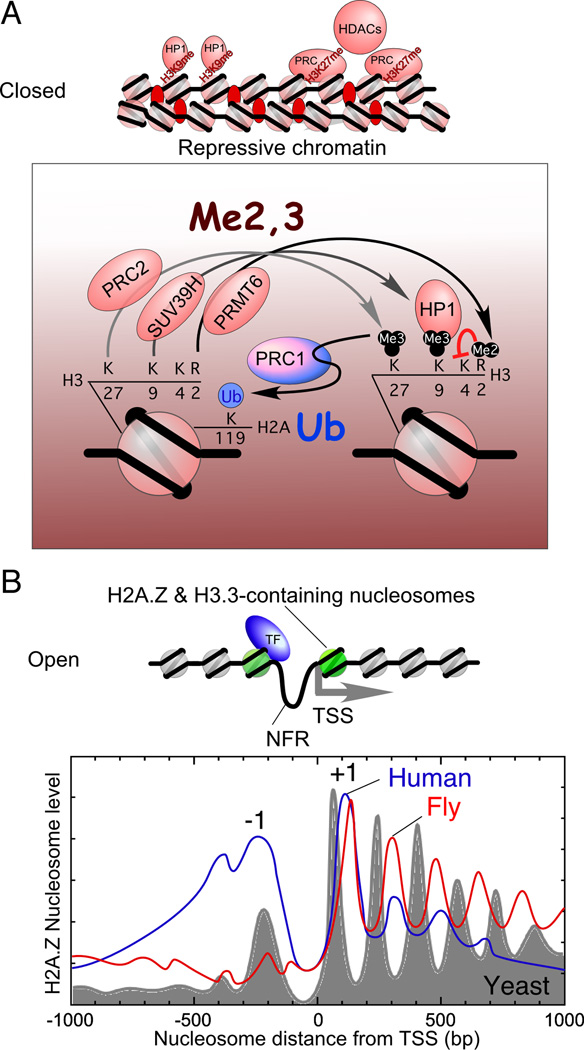
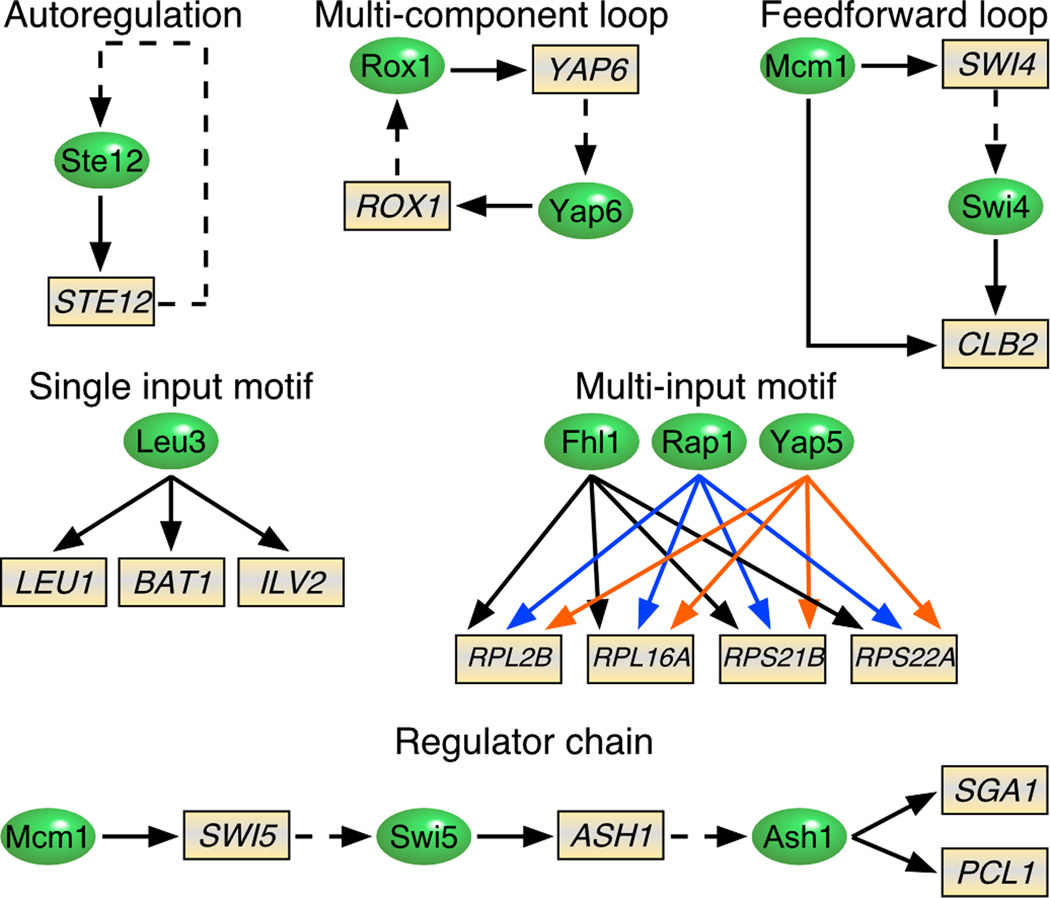
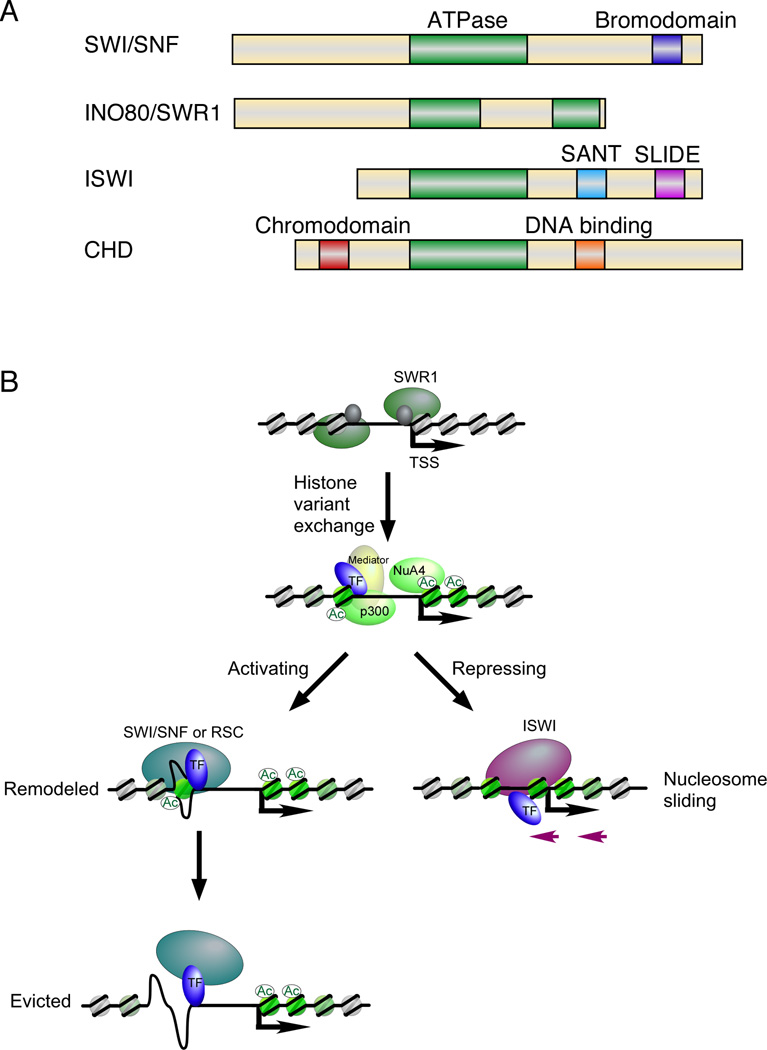
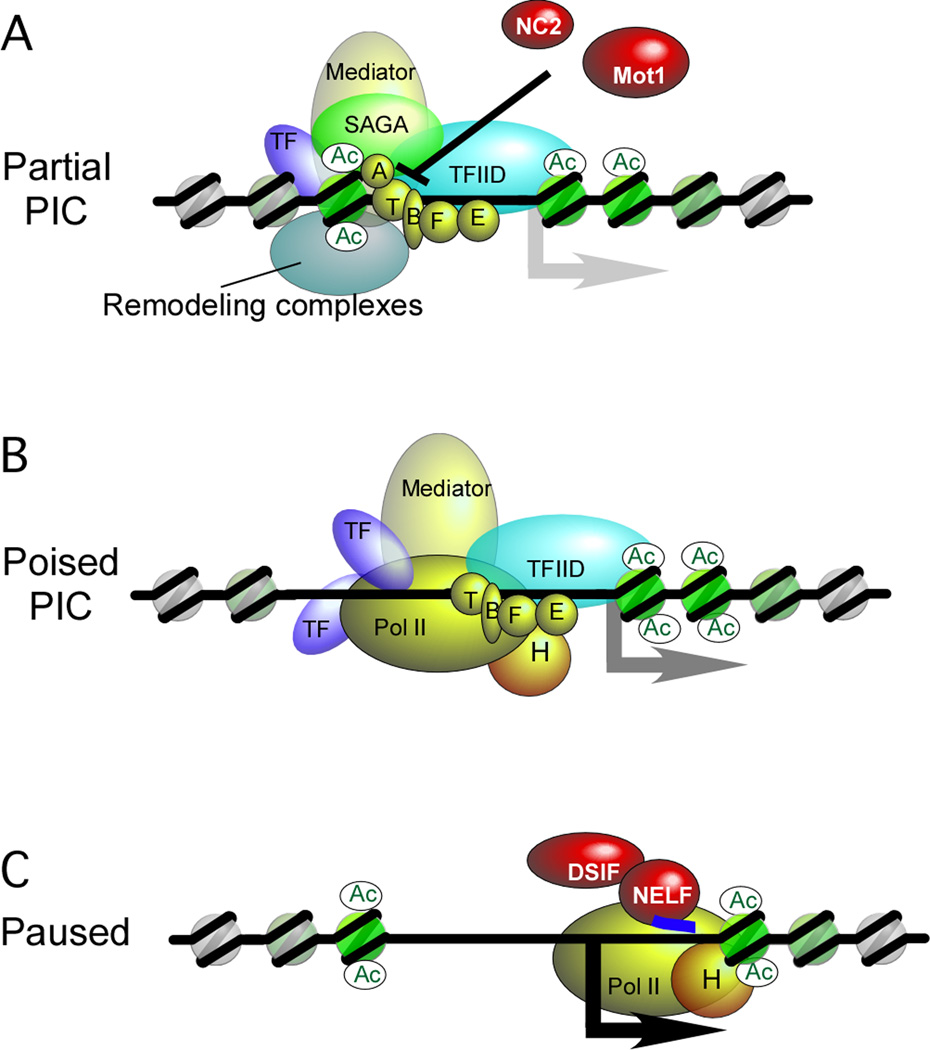
Regulation of eukaryotic gene expression is far more complex than one might have imagined 30 years ago. However, progress towards understanding gene regulatory mechanisms has been rapid and comprehensive, which has made the integration of detailed observations into broadly connected concepts a challenge. This review attempts to integrate the following concepts: (1) a well-defined organization of nucleosomes and modification states at most genes; (2) regulatory networks of sequence-specific transcription factors; (3) chromatin remodeling coupled to promoter assembly of the general transcription factors and RNA polymerase II; and (4) phosphorylation states of RNA polymerase II coupled to chromatin modification states during transcription. The wealth of new insights arising from the tools of biochemistry, genomics, cell biology, and genetics is providing a remarkable view into the mechanics of gene regulation.


Figures

Figure 1
Figure 1. ChIP assays to measure protein binding across a genome
Two DNA detection methods that make use of ChIP are illustrated. 1) In both methods, formaldehyde is used to crosslink transcription factors (TF) to the genome in vivo. 2) The DNA is then fragmented. 3) The protein is immuno-purified to remove DNA that is not bound to the TF. In ChIP-chip, the DNA crosslinked to the protein is then attached to a red dye and detected by hybridization to an array of immobilized DNA probes (microarray chip), whose sequence matches specific genomic locations. Often a reference DNA sample (illustrated in green) is co-hybridized so that probe-to-probe variation can be controlled. In ChIP-chip, the low-resolution first generation microarrays contained probes spanning all genic and/or intergenic regions. Second generation microarrays provided higher detection resolution by tiling probes across the genome at 5 base pair spacing in yeast, and ~40 bp spacing in the larger genomes of fly and human. In Chip-seq, each DNA molecule is directly sequenced. ChIP-seq achieves single base-pair detection resolution through sequencing, although the median DNA length of the ChIP sample preparation limits the spatial resolution that can be achieved by ChIP-seq. The sequencing read counts at each genomic coordinate are shown as a bar graph in a searchable genome browser screenshot (http://atlas.bx.psu.edu/).
Figure 2
Figure 2. The organization of nucleosomes throughout the genome
(A) Model for closed chromatin. Repressive chromatin is shown in a closed state that is representative of the 30 nm chromatin fiber. Nucleosome-free regions (NFRs) are absent. The resident canonical histones are methylated at a number of sites including H3K9 and/or H3K27. These sites are bound by HP1 and the PRC complexes, respectively. Compaction is mediated by linker histone H1. These repressive entities recruit histone deacetylases (HDACs) to remove activating acetyl marks on histones. (B) The promoters of most genes reside in an open chromatin state in which they are competent to undergo activation. Open chromatin is represented as a beads-on-a-string configuration in which a transcription factor (e.g. Reb1 or Abf1, indicated as “TF”) binds to its cognate site, and helps to maintain the NFR as well as to promote the replacement of canonical histones H3 and H2A, with H3.3 and H2A.Z, respectively. (In yeast, H3.3 is the same as H3.) Note that this is a composite representation and may not reflect the disposition of factors at any given gene. Shown are the frequency distributions for H2A.Z-containing nucleosomes relative to the transcriptional start site (TSS) of all genes in budding yeast, fly, and human CD4+ T cells determined by ChIP-seq (Albert et al., 2007; Mavrich et al., 2008b; Schones et al., 2008).
Figure 3
Figure 3. Regulatory networks controlled by sequence-specific transcriptional regulators
Regulatory circuits are composed of simple network motifs. Specific examples for six regulatory motifs are shown. Sequence-specific regulators and target genes are indicated by ovals and rectangles, respectively. Solid arrows denote binding of an activator to a gene promoter. Dashed arrows designate genes encoding a sequence-specific regulator. In the multi-input motif, for clarity arrows associated with the each factor are colored differently. The illustration is modified from (Lee et al., 2002).
Figure 4
Figure 4. Chromatin remodeler families and conserved domains
(A) Domain organization of the ATPase subunit of chromatin remodeling complexes. All four families share an evolutionarily conserved Snf2-like ATPase domain belonging to the DEAD/H-box helicases. The catalytic subunit of the SWI/SNF family contains a bromodomain at the C-terminus that binds acetylated lysines. The INO80/SWR1 family is distinct from the other three families by having a split ATPase domain. The ATPase subunit of the ISWI family of remodelers harbors a SANT and SLIDE domain at the C-terminus, which are thought to bind histone tails and linker DNA, respectively. The CHD family contains an N-terminal chromodomain, which binds methylated lysines, and a C-terminal DNA-binding domain. The illustration is modified from (Tsukiyama, 2002). (B) In the “open” chromatin configuration, chromatin remodeling complexes use the energy of ATP hydrolysis to dissociate DNA from the histone surface so that histone variants (H2A.Z and H3.3, shown in green) may be exchanged in, or that DNA binding sites may become exposed (activating pathway) or the sites may be covered (repressing pathway). Some of this may be facilitated by histone acetylation (p300 and NuA4 examples are indicated). The presence of an NFR may allow partial assembly of the PIC prior to nucleosome remodeling or eviction. Note that this is a composite representation and may not reflect the disposition or order of remodeling at any given gene. The absence of Mediator and other components in the later steps is only for clarity.
Figure 5
Figure 5. Assembly of the pre-initiation complex
Two forms of pre-initiation complexes and an early elongation complex are shown: A) Partial PIC (Zanton and Pugh, 2006), B) Poised PIC (Martens et al., 2001; Radonjic et al., 2005; Sekinger and Gross, 2001), and C) Paused Pol II complex (Lee et al., 2008; Muse et al., 2007; Zeitlinger et al., 2007). (A) A partial PIC contains GTFs assembled in the context of resident nucleosomes, but is relatively depleted of TFIIH and Pol II. (B) A poised PIC contains Pol II and TFIIH in addition to the GTFs and exists in the context of an evicted -1 nucleosome. The poised PIC has not yet cleared the promoter. In vivo, such complexes may be undergoing abortive initiation events where very short transcripts are released and degraded. (C) A paused Pol II complex typically occurs 30–50 nucleotides after the TSS. Negative elongation factor (NELF) and other factors (not shown) bound to Pol II help create the paused state. The +1 nucleosomes might also contribute to pausing by creating a barrier. Many initiation and regulatory factors may be retained at the promoter after Pol II has cleared the area, which might promote subsequent rounds of transcription (not shown).
Figure 6
Figure 6. Writers, readers, and erasers of the Pol II CTD code
Writers (kinases), readers, and erasers (phosphatases) of the CTD code are listed under the different phosphorylation (Ph) statuses of the CTD (single amino acid code YSPTSPS). This phosphorylation status changes from the 5’ end of genes to the 3’ end. Y1, T4, and S7 may also be phosphorylated in vivo (Baskaran et al., 1993; Egloff et al., 2007; Zhang and Corden, 1991), but their function remains to be deciphered.
Figure 7
Figure 7. Histone crosstalk and the distribution of post-translational modifications across genes
(A) Model for early elongation. Early elongation includes promoter proximal pausing, elongation factors bound to the CTD, and a cascade of histone modifications (shown in the inset and numbered 1–4). Abbreviations include: Ph, phosphorylation; Ub, ubiquitylation; Me3, trimethylation; Ac, acetylation. See text for an explanation of the model. (B) Post-translational modification network. At the hub of this histone modification network is a cycle of ubiquitylation and deubiquitylation on histone H2B, demarcated in the gray boxes. Solid arrows and red lines connect the interdependencies of post-translational modifications. The red line indicates that a particular modification blocks the subsequent modification. Histone tail modifications are highlighted with yellow boxes. Marks generally associated with initiation are shown toward the left, whereas modifications linked to elongation are shown toward the right (with the exception of H3R2me2a, which occurs during elongation to block H3K4me3), as designated by the filled arrow at the top of the panel. (C) Model for the distributions of histone modifications and phosphorylation of the Pol II CTD in relation to gene length. The nucleosome distribution relative to the TSS is shown in gray fill. The green, black, and red traces model the genome-wide distribution of the indicated histone modifications and CTD phosphorylation state.
Figure 8
Figure 8. Models for late elongation and transcription termination
(A) During late stages of the transcription cycle the phosphorylation pattern on the Pol II CTD changes from serine-5 to serine-2, with the latter being recognized by a different set of proteins. The histone modifications that are most prominent during late elongation are highlighted in the inset and numbered 1–3. Also shown are the continued modifications of H3 that occur throughout the gene. (B) Termination of Pol II transcription is accompanied by cleavage and polyadenylation factors that bind to the serine-2 phosphorylated form of the Pol II CTD. See text for details.

References

    1. Ahn SH, Kim M, Buratowski S. Phosphorylation of serine 2 within the RNA polymerase II C-terminal domain couples transcription and 3' end processing. Mol Cell. 2004;13:67–76. - PubMed
    1. Albert I, Mavrich TN, Tomsho LP, Qi J, Zanton SJ, Schuster SC, Pugh BF. Translational and rotational settings of H2A.Z nucleosomes across the Saccharomyces cerevisiae genome. Nature. 2007;446:572–576. - PubMed
    1. Almer A, Horz W. Nuclease hypersensitive regions with adjacent positioned nucleosomes mark the gene boundaries of the PHO5/PHO3 locus in yeast. Embo J. 1986;5:2681–2687. - PMC - PubMed
    1. Anderson JD, Widom J. Poly(dA-dT) promoter elements increase the equilibrium accessibility of nucleosomal DNA target sites. Mol Cell Biol. 2001;21:3830–3839. - PMC - PubMed
    1. Angus-Hill ML, Schlichter A, Roberts D, Erdjument-Bromage H, Tempst P, Cairns BR. A Rsc3/Rsc30 zinc cluster dimer reveals novel roles for the chromatin remodeler RSC in gene expression and cell cycle control. Mol Cell. 2001;7:741–751. - PubMed

Publication types