Air pollution and emergency department visits for cardiac and respiratory conditions: a multi-city time-series analysis
- PMID: 19515235
- PMCID: PMC2703622
- DOI: 10.1186/1476-069X-8-25
Air pollution and emergency department visits for cardiac and respiratory conditions: a multi-city time-series analysis
Abstract
Background: Relatively few studies have been conducted of the association between air pollution and emergency department (ED) visits, and most of these have been based on a small number of visits, for a limited number of health conditions and pollutants, and only daily measures of exposure and response.
Methods: A time-series analysis was conducted on nearly 400,000 ED visits to 14 hospitals in seven Canadian cities during the 1990 s and early 2000s. Associations were examined between carbon monoxide (CO), nitrogen dioxide (NO2), ozone (O3), sulfur dioxide (SO2), and particulate matter (PM 10 and PM2.5), and visits for angina/myocardial infarction, heart failure, dysrhythmia/conduction disturbance, asthma, chronic obstructive pulmonary disease (COPD), and respiratory infections. Daily and 3-hourly visit counts were modeled as quasi-Poisson and analyses controlled for effects of temporal cycles, weather, day of week and holidays.
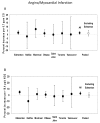
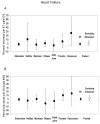
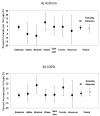
Results: 24-hour average concentrations of CO and NO2 lag 0 days exhibited the most consistent associations with cardiac conditions (2.1% (95% CI, 0.0-4.2%) and 2.6% (95% CI, 0.2-5.0%) increase in visits for myocardial infarction/angina per 0.7 ppm CO and 18.4 ppb NO2 respectively; 3.8% (95% CI, 0.7-6.9%) and 4.7% (95% CI, 1.2-8.4%) increase in visits for heart failure). Ozone (lag 2 days) was most consistently associated with respiratory visits (3.2% (95% CI, 0.3-6.2%), and 3.7% (95% CI, -0.5-7.9%) increases in asthma and COPD visits respectively per 18.4 ppb). Associations tended to be of greater magnitude during the warm season (April - September). In particular, the associations of PM 10 and PM2.5 with asthma visits were respectively nearly three- and over fourfold larger vs. all year analyses (14.4% increase in visits, 95% CI, 0.2-30.7, per 20.6 microg/m3 PM 10 and 7.6% increase in visits, 95% CI, 5.1-10.1, per 8.2 microg/m3 PM2.5). No consistent associations were observed between three hour average pollutant concentrations and same-day three hour averages of ED visits.
Conclusion: In this large multicenter analysis, daily average concentrations of CO and NO2 exhibited the most consistent associations with ED visits for cardiac conditions, while ozone exhibited the most consistent associations with visits for respiratory conditions. PM 10 and PM2.5 were strongly associated with asthma visits during the warm season.
Figures


References
-
- Stieb DM, Judek S, Burnett RT. Meta-analysis of time-series studies of air pollution and mortality: effects of gases and particles and the influence of cause of death, age, and season. J Air Waste Manag Assoc. 2002;52:470–484. - PubMed
-
- Pope CA 3rd, Dockery DW. Health effects of fine particulate air pollution: lines that connect. J Air Waste Manag Assoc. 2006;56:709–742. - PubMed
Publication types
MeSH terms
Substances
LinkOut - more resources
Full Text Sources
Medical
Miscellaneous

