. 2009 Jun 10;29(23):7395-403.
doi: 10.1523/JNEUROSCI.1341-09.2009.

Autapses and networks of hippocampal neurons exhibit distinct synaptic transmission phenotypes in the absence of synaptotagmin I

Affiliations

Autapses and networks of hippocampal neurons exhibit distinct synaptic transmission phenotypes in the absence of synaptotagmin I

Huisheng Liu et al. J Neurosci. .

Abstract

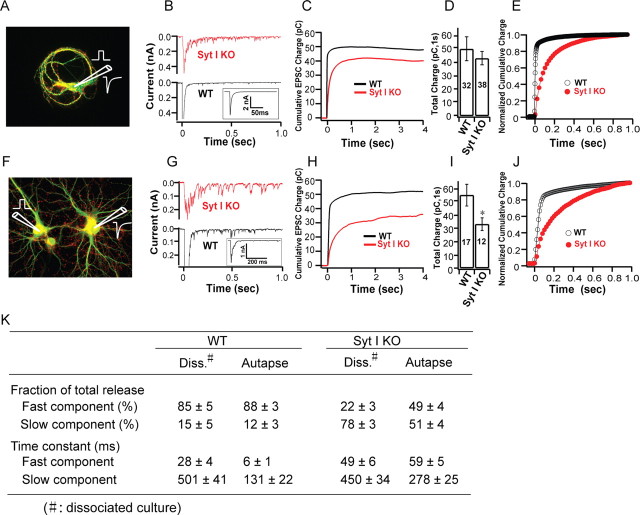
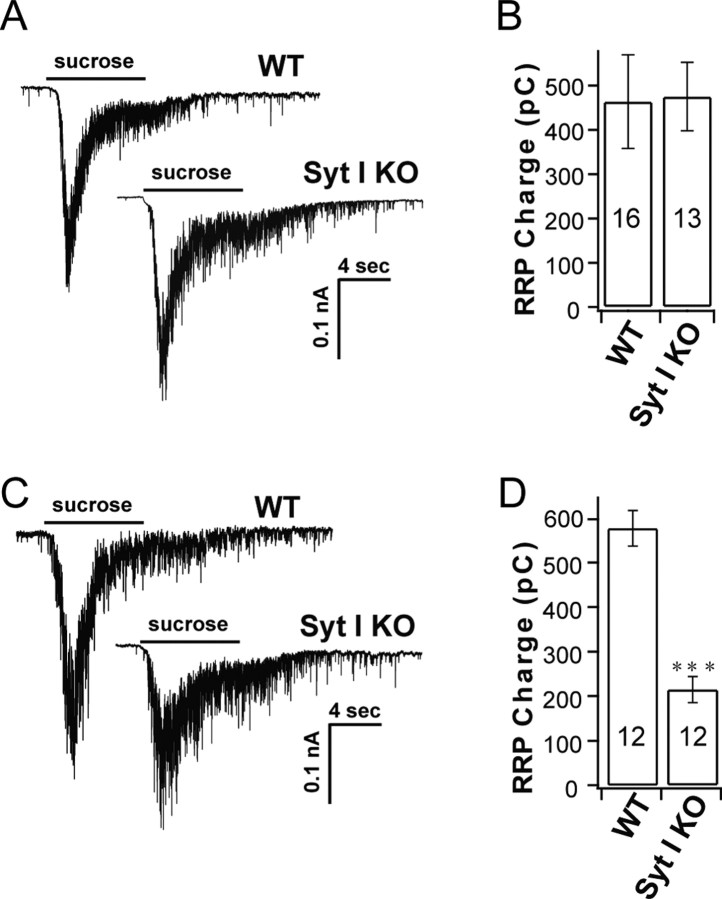
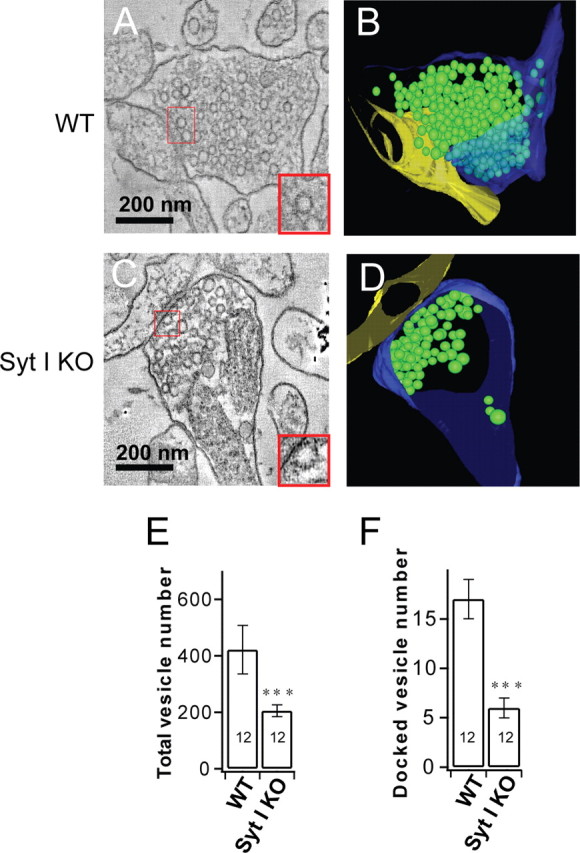
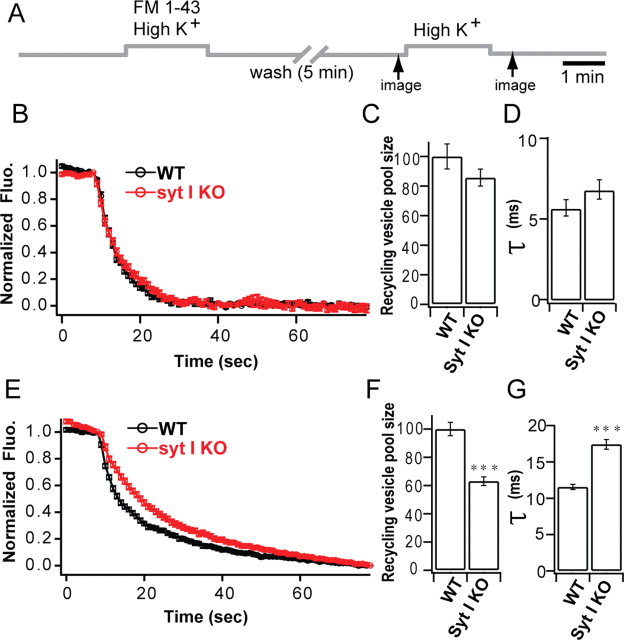
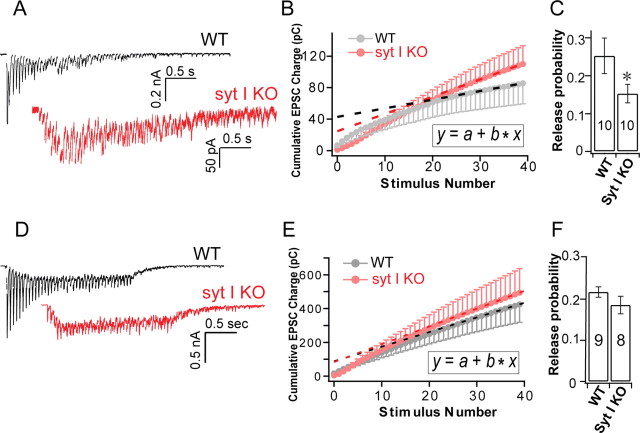
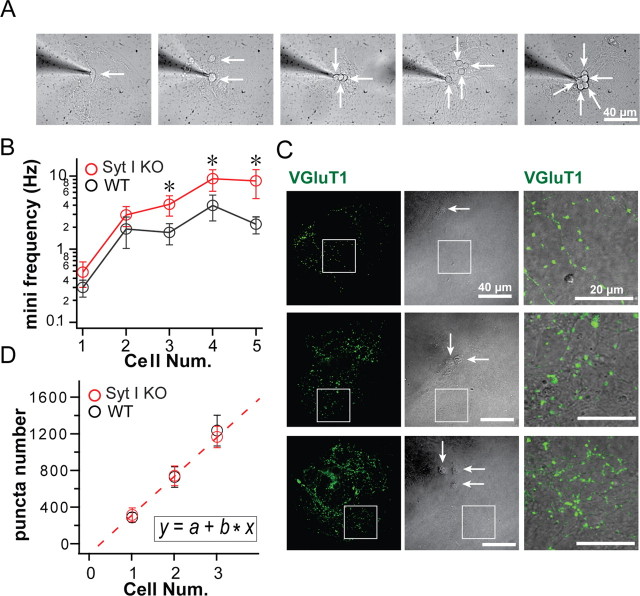
Synaptotagmin-I (syt-I) is required for rapid neurotransmitter release in mouse hippocampal neurons. However, contradictory results have been reported regarding evoked and spontaneous secretion from syt-I knock-out (KO) neurons. Here, we compared synaptic transmission in two different hippocampal neuron preparations: autaptic cultures in which a single isolated cell innervates itself, and dissociated mass cultures in which individual cells are innervated by neighboring cells. In autaptic cultures, the total extent of evoked release, size of readily releasable pool of synaptic vesicles, and release probability were unchanged in syt-I KO neurons. In contrast, in cultures containing multiple interconnected neurons, total evoked release, the number of docked vesicles, and release probability, were significantly reduced in syt-I KO neurons. Using a micronetwork system in which we varied the number of cells on an island, we found that the frequency of spontaneous synaptic vesicle fusion events (minis) was unchanged in syt-I KO neurons when two or fewer cells were present on an island. However, in micronetworks composed of three or more neurons, mini frequency was increased threefold to fivefold in syt-I KO neurons compared with wild type. Moreover, interneuronal synapses exhibited higher rates of spontaneous release than autaptic synapses. This higher rate was attributable to an increase in release probability because excitatory hippocampal neurons in micronetworks formed a set number of synapses per cell regardless of the number of connected neurons. Thus, aspects of synaptic transmission differ between autaptic and dissociated cultures, and the synaptic transmission phenotype, resulting from loss of syt-I, is dictated by the connectivity of neurons.


Figures

Figure 1.
Figure 1.
The extent of evoked release in syt-I KOs is normal in autapses but reduced in dissociated cultures of hippocampal neurons. A–E, Recordings from autaptic cultures. A, An autaptic culture depicting the recording scheme (red, synapsin; green, MAP2). B, Evoked EPSCs from WT (black line) and syt-I KO (red line) neurons. The inset shows full current scale of WT neurons. C, Average cumulative evoked EPSC charges for WT (n = 32) and syt-I KO (n = 38) neurons. D, Total EPSC charge in WT (48.05 ± 9.2 pC) and syt-I KO (43.96 ± 5.12 pC) neurons. E, Normalized cumulative total charge averaged and fitted by a double-exponential function (solid line). F–J, Recordings from dissociated cultures. F, Recording scheme used for dissociated cultures (red, synapsin; green, MAP2). G, Evoked EPSCs from WT (black line) and syt-I KO (red line) dissociated cultures. The inset shows full current scale of WT neurons. H, Average cumulative evoked EPSC charges for WT (n = 17) and syt-I KO (n = 12) neurons. I, Total EPSC charge in WT (55.4 ± 8.26 pC) and syt-I KO (33.3 ± 4.78 pC) neurons. J, Normalized total charge averaged and fitted by a double-exponential function (solid line). K, Kinetics of evoked responses from WT and syt-I KO neurons determined by fitting individual normalized total charge traces. The asterisks indicate statistically significant differences for syt-I KO versus WT: *p < 0.05. All data shown represent means ± SEM.
Figure 2.
Figure 2.
The RRP size in syt-I KOs is unchanged in autaptic cultures but reduced in dissociated cultures of hippocampal neurons. A, Representative sucrose responses from autaptic cultures of WT and syt-I KO neurons. B, Total charge transfer from autaptic cultures was the same between WT (463.65 ± 106 pC; n = 16) and syt-I KO (474.95 ± 77 pC; n = 13) neurons. C, Representative sucrose responses from dissociated cultures of WT and syt-I KO neurons. D, Total charge transfer from dissociated cultures was reduced in syt-I KO (214.84 ± 29 pC; n = 12) compared with WT (577.77 ± 40 pC; n = 12) neurons. The asterisks indicate statistically significant differences for syt-I KO versus WT: ***p < 0.001. All data shown represent means ± SEM.
Figure 3.
Figure 3.
Loss of syt-I results in reduced numbers of total and docked synaptic vesicles in dissociated cultures of hippocampal neurons. A, Representative electron micrograph of a WT synapse. The inset shows docked vesicles. B, Tomographic reconstruction of the synapse shown in A. C, Representative electron micrograph of a syt-I KO synapse. The inset shows docked vesicles. D, Tomographic reconstruction of the synapse shown in C. E, Plot of the number of vesicles per terminal (n = 12 tomograms) in WT (421 ± 86) and syt-I KO (205 ± 21) neurons. F, Plot of the number of docked vesicles per terminal (n = 12 tomograms) in WT (17 ± 2) and syt-I KO (6 ± 1) neurons. The asterisks indicate statistically significant differences for syt-I KO versus WT: ***p < 0.001. All data shown represent means ± SEM.
Figure 4.
Figure 4.
Analysis of synaptic vesicle recycling using FM1-43 in syt-I KO autaptic and dissociated cultures. A, Experimental scheme for uptake and destaining of FM1-43 from autaptic and dissociated cultures. Synaptic vesicles were loaded with FM1-43 for 2 min using high [K+]. Images were acquired at 1 s intervals between the time points indicated by arrows. B–D, Measurement of FM1-43 destaining in autaptic cultures. B, Normalized rate of FM1-43 destaining of syt-I KO (n = 51; 5 different coverslips) versus WT neurons (n = 50; 5 different coverslips). C, Normalized recycling vesicle pool size calculated from the total FM1-43 destain is unchanged in syt-I KO compared with WT neurons (WT, 100 ± 8.50%; KO, 85.70 ± 5.77%). D, The rate of FM1-43 destaining, calculated from single-exponential fits to the data in B, is similar between syt-I KO and WT neurons (WT, 5.81 ± 0.50 ms; KO, 6.93 ± 0.60 ms). E–G, Measurement of FM1-43 destaining in dissociated cultures. E, Normalized rate of FM1-43 destaining of syt-I KO (n = 80; 6 different coverslips) versus WT neurons (n = 80; 4 different coverslips). F, Normalized recycling vesicle pool size calculated by FM1-43 destain magnitude is significantly reduced in syt-I KO neurons compared with WT neurons (WT, 100 ± 4.69%; KO, 63.10 ± 3.03%). G, The rate of FM1-43 destaining, calculated from single-exponential fitting of the data in E, is significantly slower in syt-I KO neurons compared with WT neurons (WT, 11.56 ± 0.37 ms; KO, 17.41 ± 0.64 ms). The asterisks indicate statistically significant differences: ***p < 0.001. All data shown represent means ± SEM.
Figure 5.
Figure 5.
Loss of syt-I reduces the release probability in dissociated, but not autaptic, hippocampal cultures. A–C, Recordings from dissociated cultures. A, Representative EPSCs trains (40 stimuli; 20 Hz) recorded from syt-I KO and WT neurons. Presynaptic stimulus transients have been removed for clarity. B, Plot of average cumulative EPSCs area from each neuron versus stimulus number. The dashed line represents a linear function (inset) fit to data points between the 30th to the 40th EPSCs to estimate the RRP size (y-intercepts). C, Release probability, calculated by single evoked EPSC charge divided by the RRP size from the paired measurement on the same cell, was significantly reduced in syt-I KO neurons compared with WT (WT, 0.25 ± 0.04, n = 10; KO, 0.15 ± 0.02, n = 10). D–F, Recordings from autaptic cultures. D, Representative EPSCs trains (40 stimuli; 20 Hz) recorded from WT and syt-I KO neurons. E, Plot of average cumulative EPSC area from each neuron versus stimulus number. The dashed line represents a linear function (inset) fit to data points from the 30th to the 40th EPSCs to estimate the RRP size (y-intercepts). F, Release probability, calculated by single evoked EPSC charge divided by the RRP size from the paired measurement on the same cell, was similar between WT and syt-I KO neurons (WT, 0.21 ± 0.01, n = 9; KO, 0.18 ± 0.02, n = 8). Recordings of EPSCs trains were corrected for nonsynaptic artifacts by subtraction of a record obtained in the presence of CNQX (100 μm) to obtain accurate measurements of EPSC charge. The charges integrals include all synchronous and asynchronous release. The asterisks indicate statistically significant differences: *p < 0.05. All data shown represent means ± SEM.
Figure 6.
Figure 6.
Analysis of mEPSC frequency and synapse number in micronetworks. A, Image of micronetworks consisting of one to five hippocampal neurons (white arrows). B, The frequency of mEPSCs was unchanged between WT and syt-I KO micronetworks of one neuron (WT, 0.29 ± 0.07 Hz, n = 8; syt-I KO, 0.47 ± 0.18 Hz, n = 9) or two neurons (WT, 1.85 ± 0.84 Hz, n = 7; syt-I KO, 2.89 ± 0.88 Hz, n = 11). mEPSC frequency was increased in syt-I KO neurons compared with WT in microislands of three (WT, 1.65 ± 0.53 Hz, n = 6; syt-I KO, 4.04 ± 1.25 Hz, n = 7; p = 0.025), four (WT, 3.9 ± 1.5 Hz, n = 9; syt-I KO, 9.08 ± 2.98 Hz, n = 10; p = 0.033), or five neurons (WT, 2.15 ± 0.56 Hz, n = 7; syt-I KO, 8.48 ± 3.64 Hz, n = 8; p = 0.022). C, VGluT1 immunostaining of glutamatergic synapses in microislands containing one, two, or three neurons (white arrows). The right panel is an enlarged image of the indicated rectangular area in the left and middle panels; note the different scale in these panels. D, The number of synapses in microislands consisting of one (WT, 309 ± 57, n = 9; KO, 337 ± 79, n = 9), two (WT, 746 ± 119, n = 7; KO, 761 ± 115, n = 8), or three neurons (WT, 1250 ± 181, n = 6; KO, 1177 ± 125, n = 6) was the same in WT and syt-I KO neurons. The total synapse number was plotted versus the number of neurons, and these data were fitted with a linear function (inset, dashed line). This plot (b value) revealed that an average of 445 synapses was formed per neuron. The asterisks indicate statistically significant differences for syt-I KO versus WT: *p < 0.05. All data shown represent means ± SEM.

Similar articles

Cited by

References

    1. Augustin I, Rosenmund C, Südhof TC, Brose N. Munc13-1 is essential for fusion competence of glutamatergic synaptic vesicles. Nature. 1999;400:457–461. - PubMed
    1. Bekkers JM, Stevens CF. Excitatory and inhibitory autaptic currents in isolated hippocampal neurons maintained in cell culture. Proc Natl Acad Sci U S A. 1991;88:7834–7838. - PMC - PubMed
    1. Broadie K, Bellen HJ, DiAntonio A, Littleton JT, Schwarz TL. Absence of synaptotagmin disrupts excitation-secretion coupling during synaptic transmission. Proc Natl Acad Sci U S A. 1994;91:10727–10731. - PMC - PubMed
    1. Chapman ER. How does synaptotagmin trigger neurotransmitter release? Annu Rev Biochem. 2008;77:615–641. - PubMed
    1. Chicka MC, Hui E, Liu H, Chapman ER. Synaptotagmin arrests the SNARE complex before triggering fast, efficient membrane fusion in response to Ca2+ . Nat Struct Mol Biol. 2008;15:827–835. - PMC - PubMed

Publication types

MeSH terms