. 2009 Jun 10;29(23):7497-503.
doi: 10.1523/JNEUROSCI.6044-08.2009.

A second function of gamma frequency oscillations: an E%-max winner-take-all mechanism selects which cells fire

Affiliations

A second function of gamma frequency oscillations: an E%-max winner-take-all mechanism selects which cells fire

Licurgo de Almeida et al. J Neurosci. .

Abstract

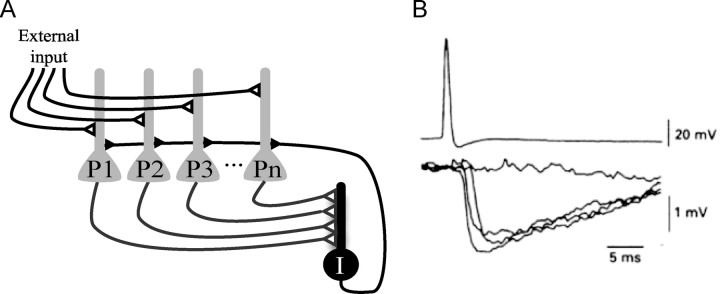
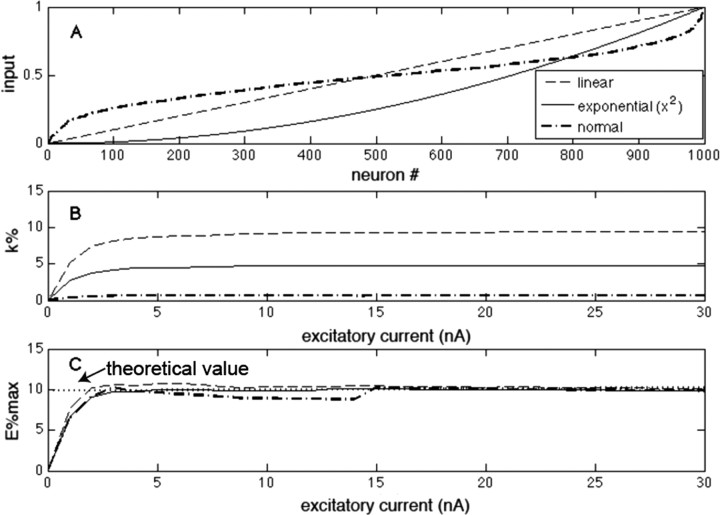
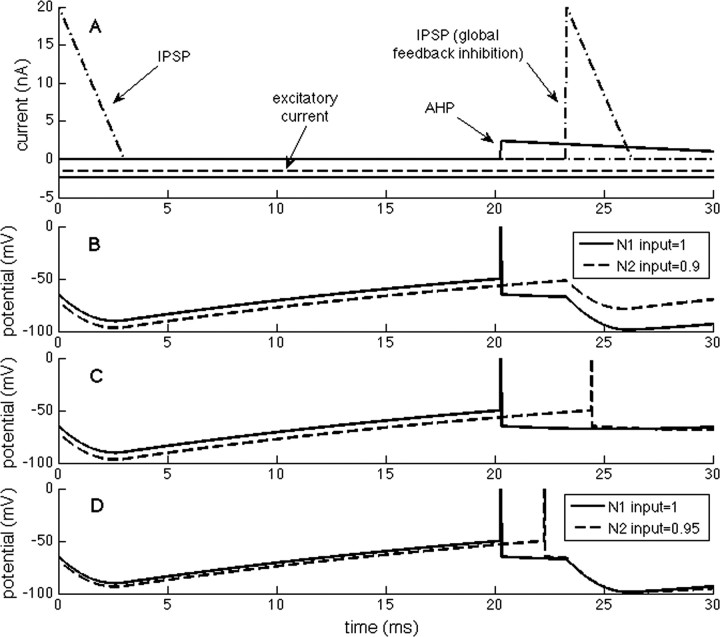
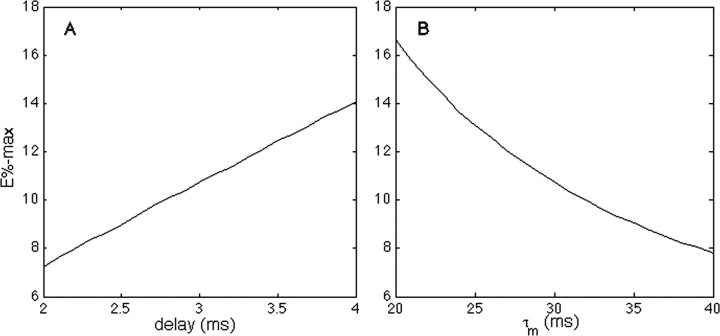
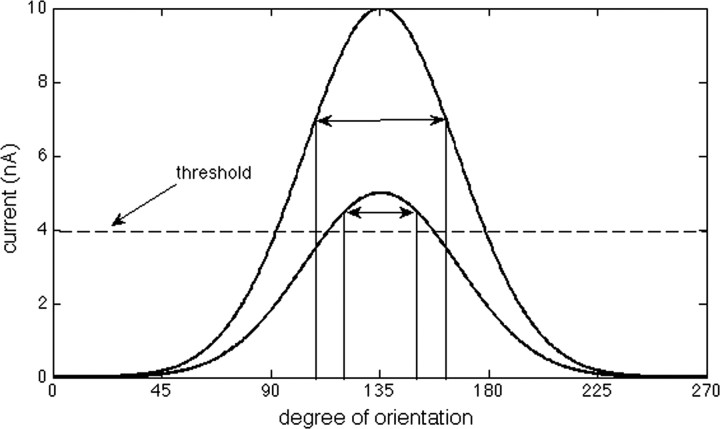
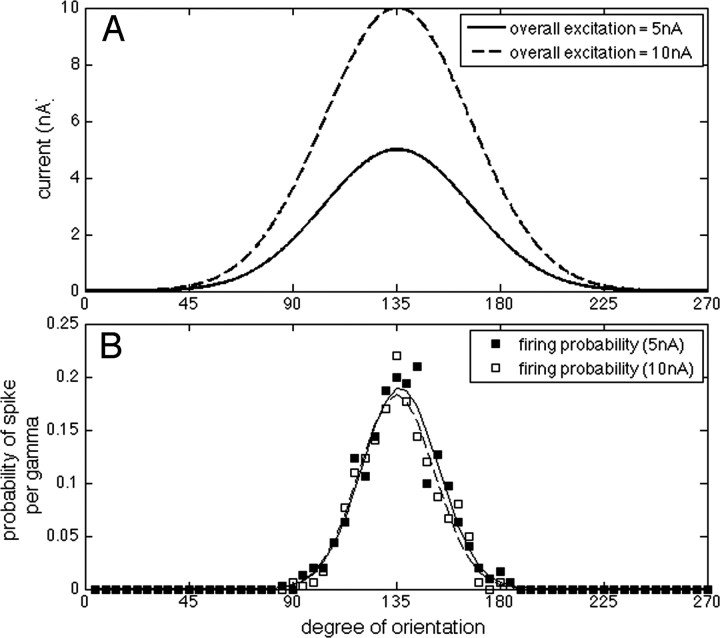
The role of gamma oscillations in producing synchronized firing of groups of principal cells is well known. Here, we argue that gamma oscillations have a second function: they select which principal cells fire. This selection process occurs through the interaction of excitation with gamma frequency feedback inhibition. We sought to understand the rules that govern this process. One possibility is that a constant fraction of cells fire. Our analysis shows, however, that the fraction is not robust because it depends on the distribution of excitation to different cells. A robust description is termed E%-max: cells fire if they have suprathreshold excitation (E) within E% of the cell that has maximum excitation. The value of E%-max is approximated by the ratio of the delay of feedback inhibition to the membrane time constant. From measured values, we estimate that E%-max is 5-15%. Thus, an E%-max winner-take-all process can discriminate between groups of cells that have only small differences in excitation. To test the utility of this framework, we analyzed the role of oscillations in V1, one of the few systems in which both spiking and intracellular excitation have been directly measured. We show that an E%-max winner-take-all process provides a simple explanation for why the orientation tuning of firing is narrower than that of the excitatory input and why this difference is not affected by increasing excitation. Because gamma oscillations occur in many brain regions, the framework we have developed for understanding the second function of gamma is likely to have wide applicability.


Figures

Figure 1.
Figure 1.
A, Network structure showing interconnections of principal cells and an interneuron. Principal cells (P1 to Pn) receive external excitatory input. Principal cells excite an inhibitory interneuron (I) that provides feedback inhibition to all principal cells. B, An action potential (top trace) in a pyramidal neuron in the CA3 region of the hippocampus produces rapid disynaptic feedback inhibition in a nearby pyramidal neuron (bottom; several traces superposed). The entire process is very rapid: there is only a 2–3 ms delay between the action potential in the principal cell and the feedback inhibition of principal cells. Note: feedback inhibition probably also occurred in the cell that fired the action potential but is hard to detect because of the potassium conductances (and resulting hyperpolarization) activated by the action potential in that cell. Reprinted with permission from Miles (1990).
Figure 2.
Figure 2.
Comparison of a k-winner-take-all description with an E%-max winner-take-all description. A, Graph of the input excitation of 1000 different neurons in the network. The minimum excitation is always zero, and the values are relative to the cell with maximal excitation (excitatory current). Neurons here are ranked in terms of increasing excitation. Several distributions are plotted (same legend for A–C). B, The number of winners (k%) as excitation is scaled up. C, E%-max as excitation is scaled up. The dotted line in C indicates the theoretical value derived in Results.
Figure 3.
Figure 3.
Events that govern the selection process in a network with feedback inhibition. One neuron (N2) receives 10% less excitation than the other (N1). A, The component currents of N1 and N2 (solid/dashed lines). At the left, there is onset of inhibition because of the previous gamma cycle (details not shown). B, As inhibition decays, threshold is reached in N1, causing an action potential. This is followed by an AHP in N1 and feedback inhibition in both cells (with a delay of 3 ms). During this delay, the decline of inhibition in N2 is not sufficient for that cell to reach threshold. C, If the feedback inhibition is prevented, N2 fires. D, If the excitation of N2 is only 5% less than N1, N2 fires.
Figure 4.
Figure 4.
The effect of the delay of feedback inhibition (A) and membrane time constant (B) on E%-max.
Figure 5.
Figure 5.
Tuning changes produced by the iceberg effect. The bottom curve shows orientation tuning of excitation relative to threshold (dashed line). As shown in the bottom curve, the width of the tuning of firing (double arrow) can be quite narrow because only a few orientations are above threshold (the iceberg effect). However, if the overall level of excitation is scaled up (higher curve), as would occur if image contrast is enhanced, the tuning becomes broader, contrary to experimental observations.
Figure 6.
Figure 6.
Orientation tuning of firing is unaffected by increasing excitation (contrast) in an integrate-and-fire network with gamma frequency inhibition. A, Tuning of excitatory input as a function or orientation (same as in Fig. 5) at two different levels of contrast. B, Orientation tuning of firing in simulations. Curve fits to data show no effect of enhancing contrast on tuning. The responses were fit by where x is the degree of orientation. For the lower level of contrast (filled squares), A = 0.19, B = 135, and C = 20.4; for higher contrast (open squares), A = 0.183, B = 134.9, and C = 19.74. The value of E%-max was 10%, based on results from hippocampus. The fact that the calculated tuning of spikes (16.5°) is narrower than observed experimentally (23°) could be because E%-max is higher in V1 or because noise levels are higher than we assumed (see Materials and Methods).

References

    1. Anderson JS, Lampl I, Gillespie DC, Ferster D. The contribution of noise to contrast invariance of orientation tuning in cat visual cortex. Science. 2000;290:1968–1972. - PubMed
    1. Andrade R. Cell excitation enhances muscarinic cholinergic responses in rat association cortex. Brain Res. 1991;548:81–93. - PubMed
    1. Araneda R, Andrade R. 5-Hydroxytryptamine 2 and 5-hydroxytryptamine 1A receptors mediate opposing responses on membrane excitability in rat association cortex. Neuroscience. 1991;40:399–412. - PubMed
    1. Bartos M, Vida I, Jonas P. Synaptic mechanisms of synchronized gamma oscillations in inhibitory interneuron networks. Nat Rev Neurosci. 2007;8:45–56. - PubMed
    1. Bragin A, Jandó G, Nádasdy Z, Hetke J, Wise K, Buzsáki G. Gamma (40–100 Hz) oscillation in the hippocampus of the behaving rat. J Neurosci. 1995;15:47–60. - PMC - PubMed

Publication types

LinkOut - more resources