

Review
doi: 10.1021/jo900497s.
Perspectives on computational organic chemistry
Affiliations
- PMID: 19518150
- PMCID: PMC2728082
- DOI: 10.1021/jo900497s
Item in Clipboard
Review
Perspectives on computational organic chemistry
J Org Chem.
.
Abstract
The author reviews how his early love for theoretical organic chemistry led to experimental research and the extended search for quantitative correlations between experiment and quantum calculations. The experimental work led to ion pair acidities of alkali-organic compounds and most recently to equilibria and reactions of lithium and cesium enolates in THF. This chemistry is now being modeled by ab initio calculations. An important consideration is the treatment of solvation in which coordination of the alkali cation with the ether solvent plays a major role.
Figures
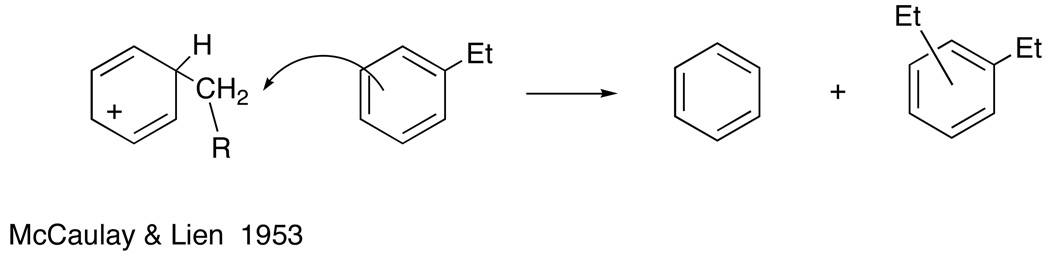
SN2 displacement mechanism for disproportionation.
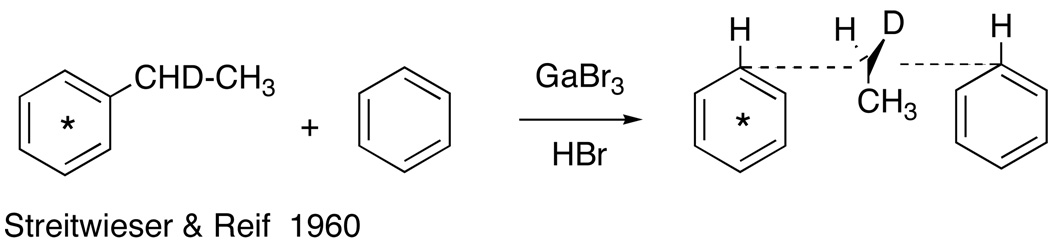
Proposed test of the SN2 displacement mechanism with labeled optically active (ethyl-1-d)benzene in excess benzene.
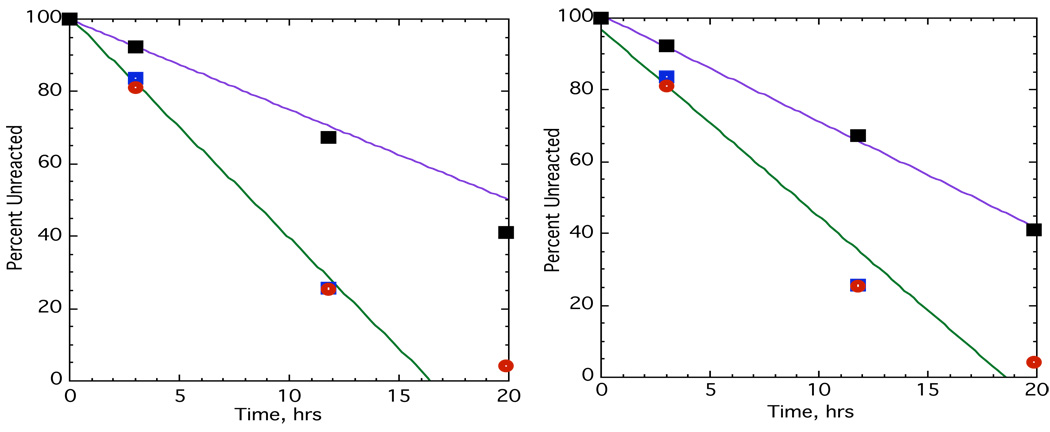
Two runs showing the reaction of opically active (ethyl-1-d)benzene labeled in the ring with 14C with GaBr3-HBr in benzene. Blue squares show optical activity, red circles are radioactivity and black squares are d1.
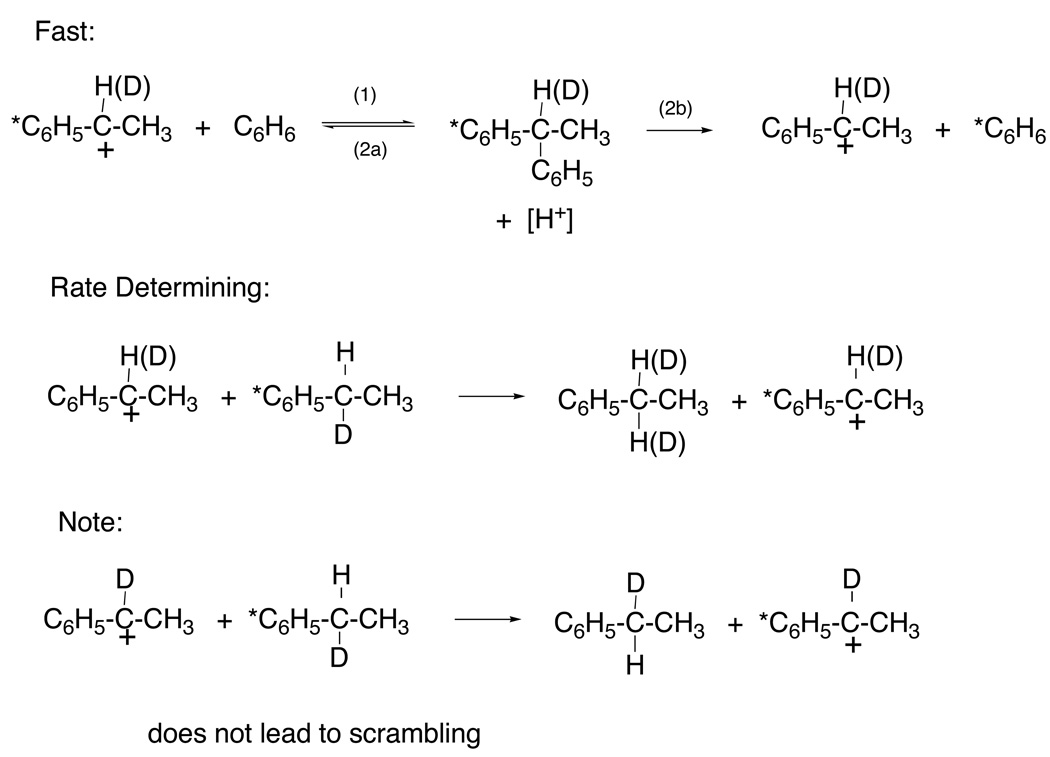
New mechanism for trans-ethylation.
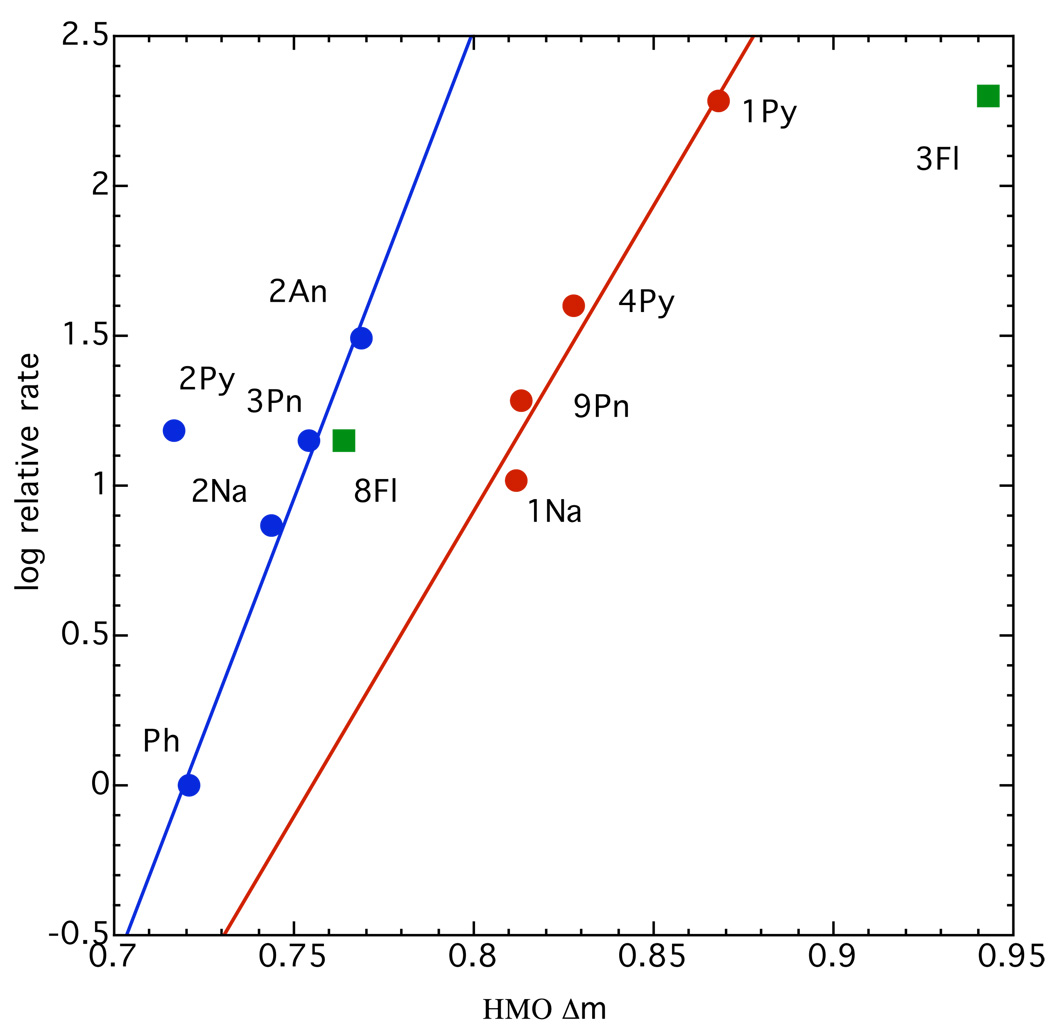
Relative exchange rates of ArCH2D with lithium cyclohexylamide in cyclohexylamine. The polycyclic hydrocarbons are: Ph, benzene; Na, naphthalene; Pn, phenanthrene; An, anthracene; Py, pyrene; Fl, fluoranthene.
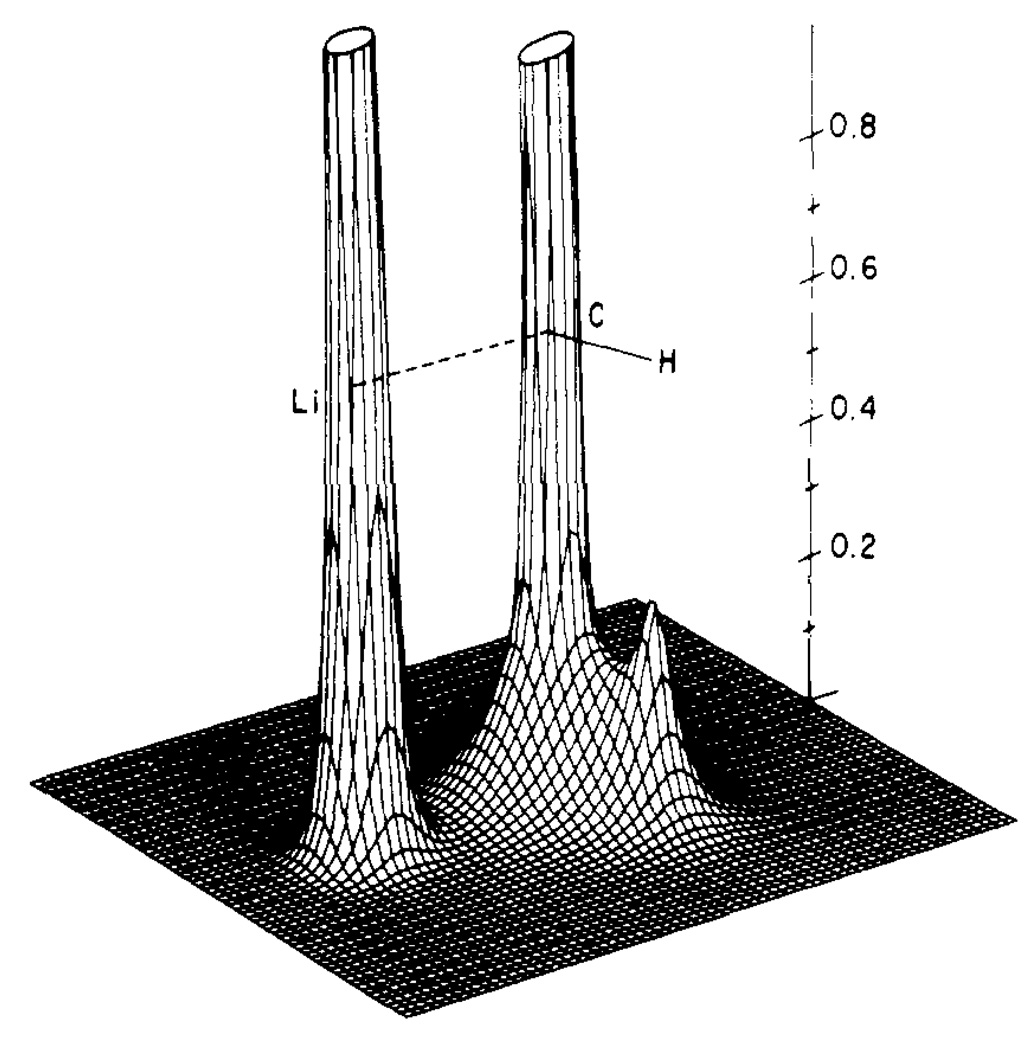
Electron density function for methyllithium for the plane shown in units of e au−3. Compare the deep valley between C and Li with the high ridge between C and H. [Reproduced from ref. Copyright 1976 American Chemical Society]
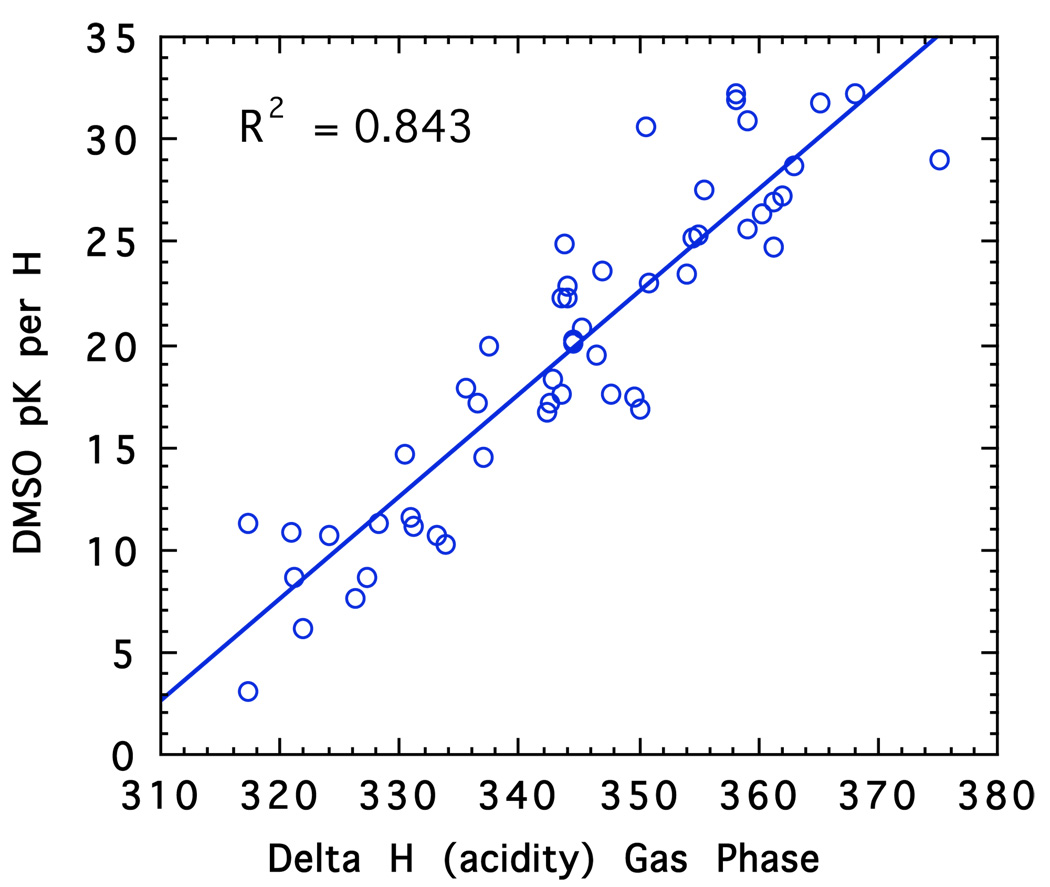
Comparison of pKa’s in DMSO with gas phase acidities.
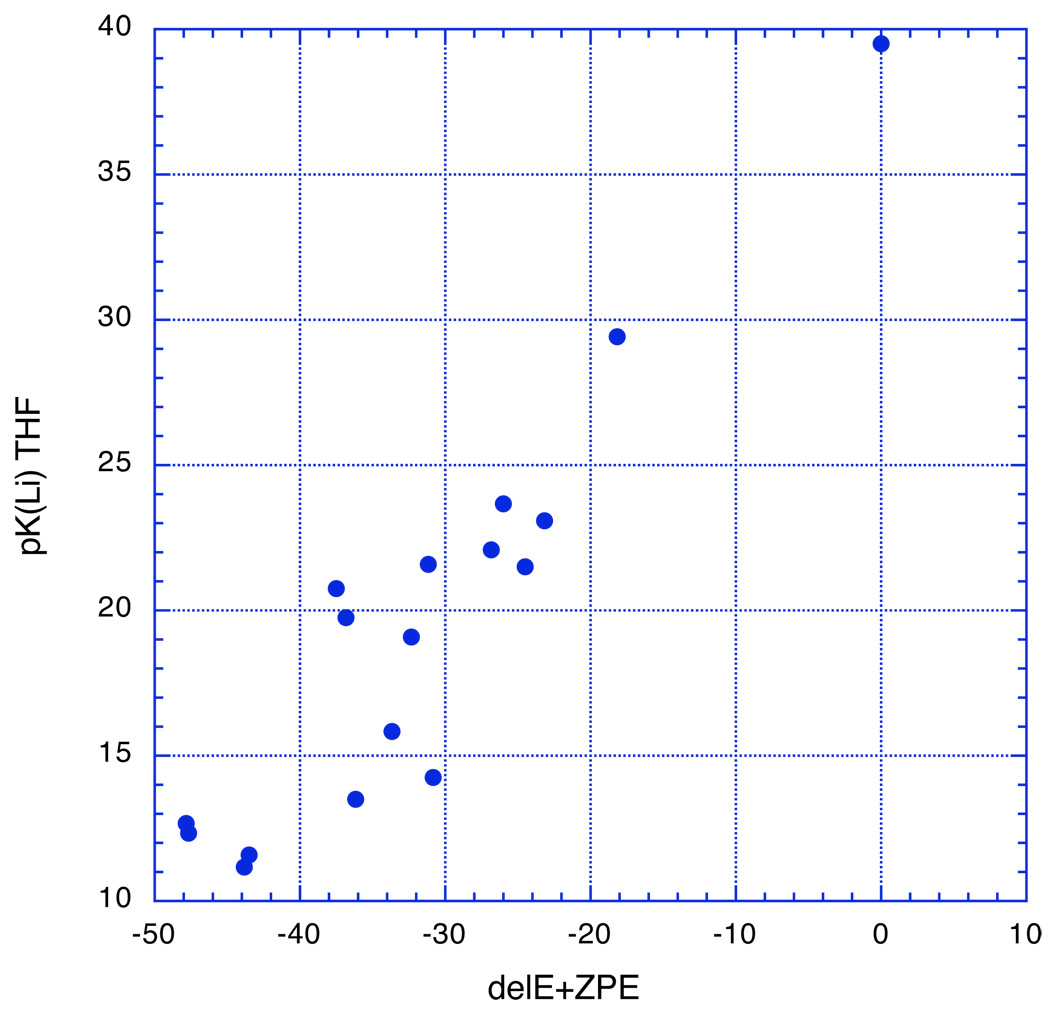
Plot of the experimental Li pK’s in Table 1 vs the electronic energy + ZPE at HF 6–31+G(d).
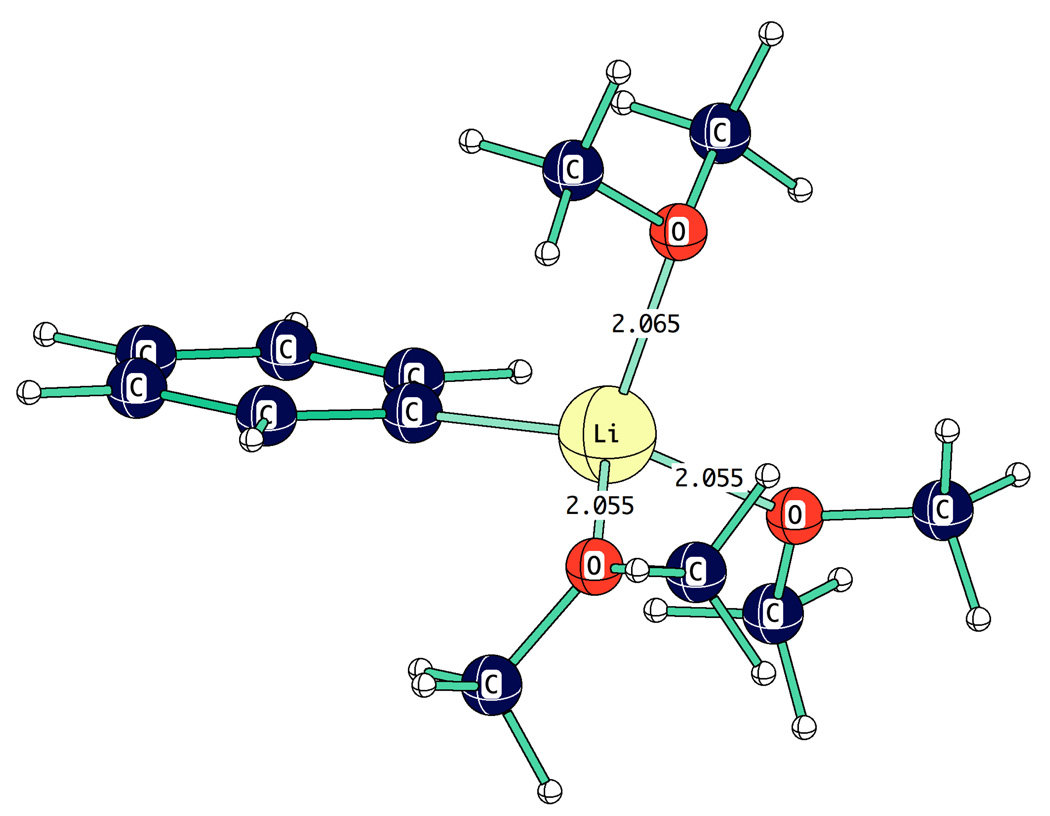
Computed structure of PhLi.3Me2O.
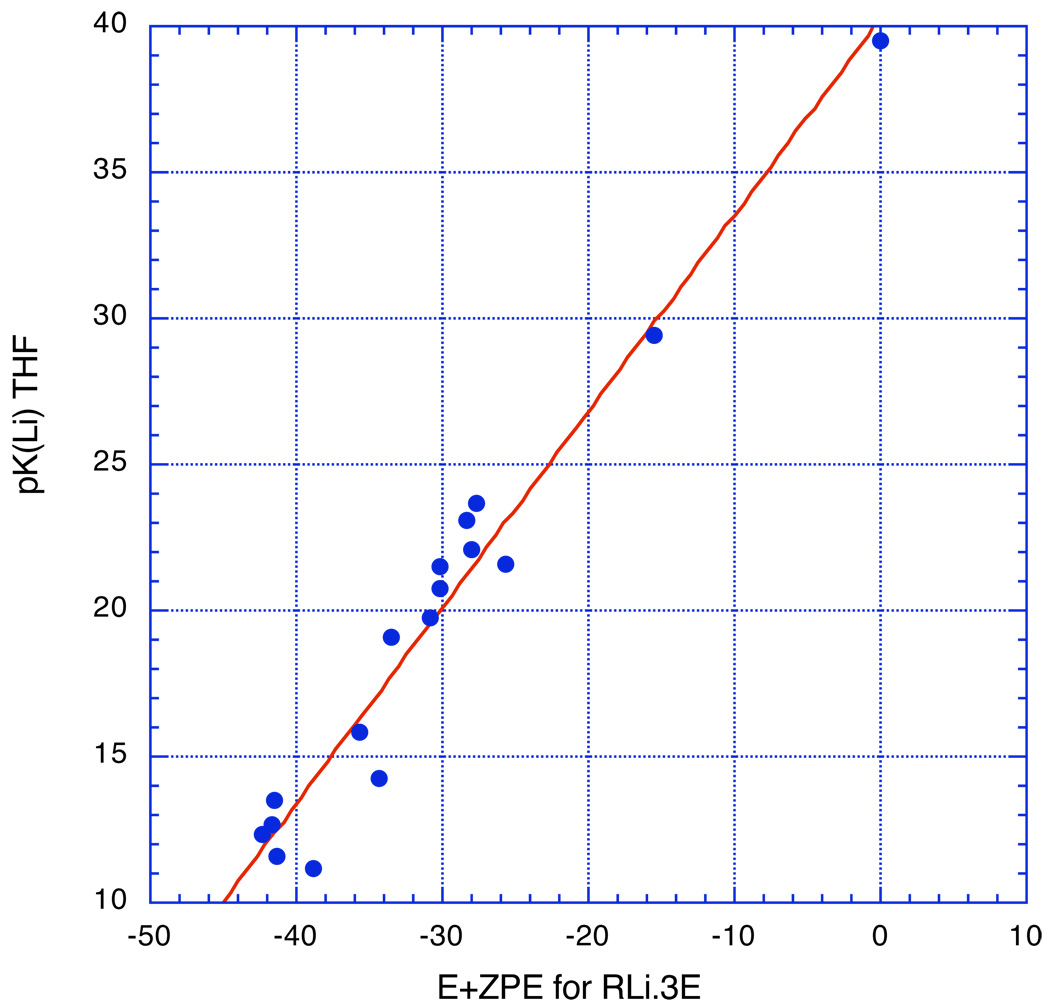
Experimental Li pK’s in Table 1 for eq. 2 relative to benzene, HF 6–31+G(d). The regression line is pK = 40.25 ± 1.17 + (0.671 ± 0.036)ΔE, R2 = 0.96.
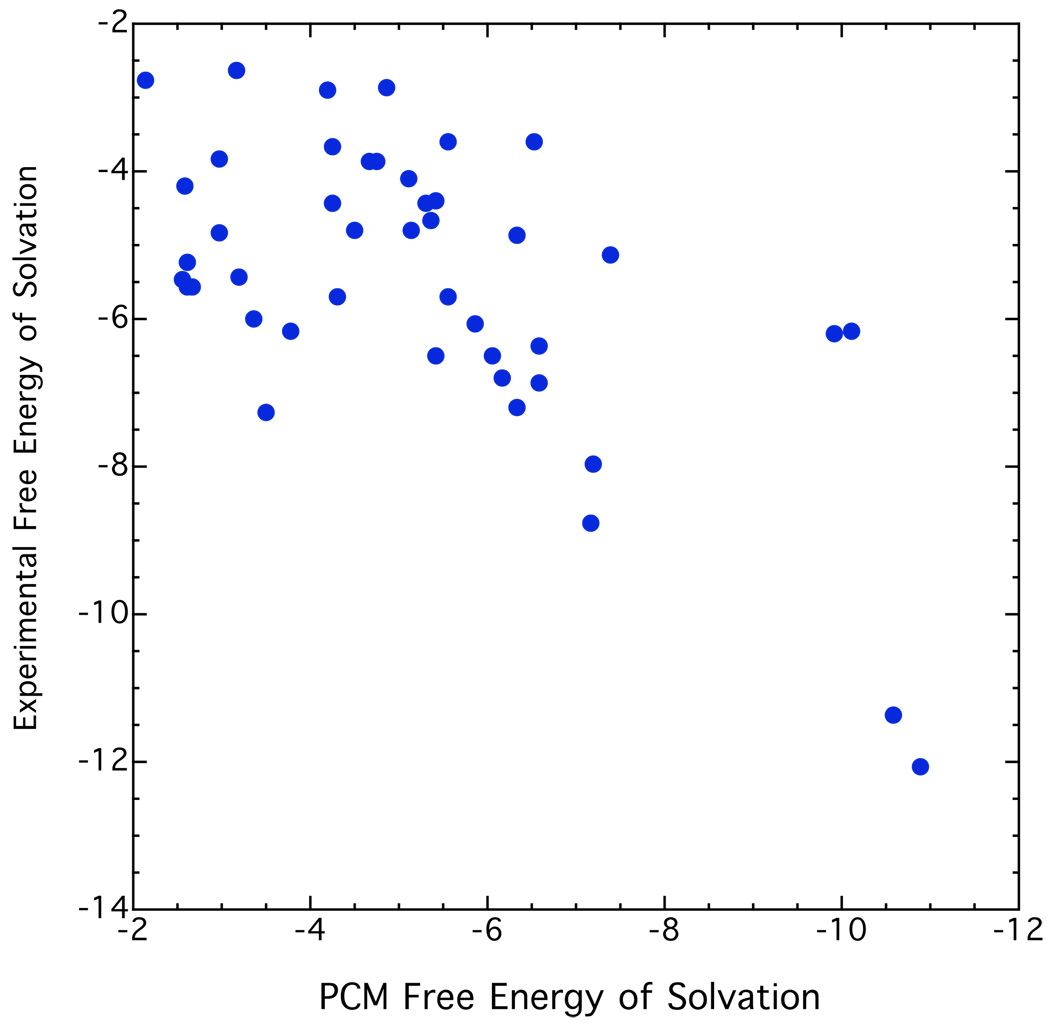
Experimental and computed free energies of solvation, Kcal mol−1, ref.
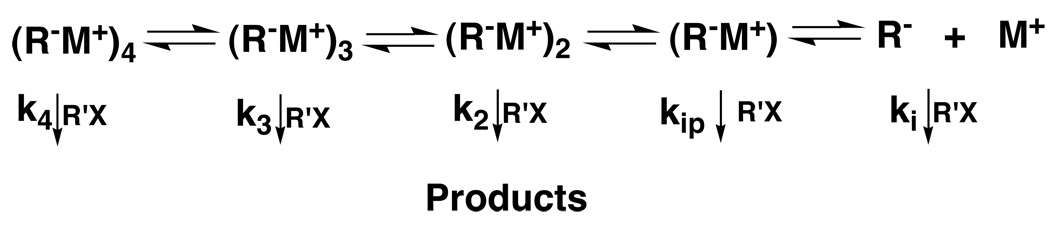
Curtin-Hammett equilibria for enolate aggregation and reaction. Each kn is the rate constant for the reaction of the corresponding RM system (e.g, (R− M+)n) with R’X.
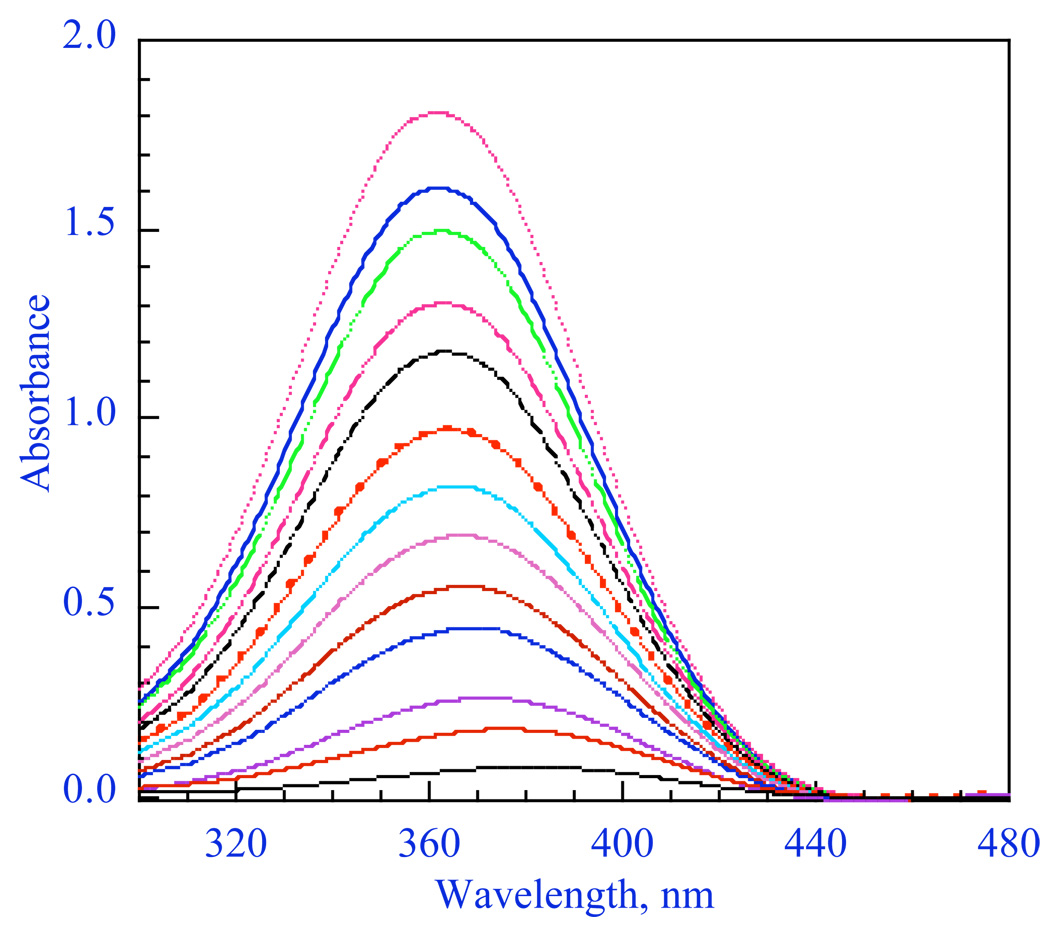
Spectra of LiBiphCHX, the lithium enolate of 2-(p-biphenylyl)cyclohexanone as a function of concentration in THF at 25° C.
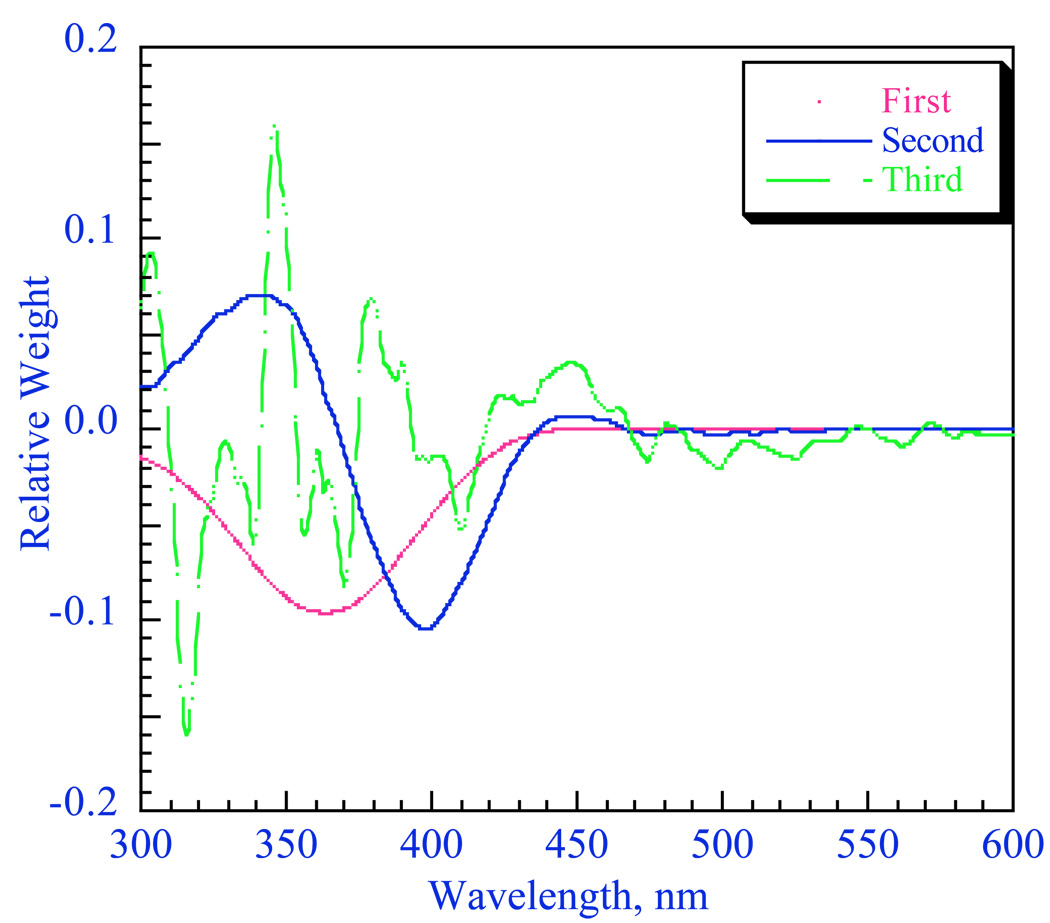
First three SVD vectors for the data in Fig. 11. The relative weights are S1=55.45, S2=2.32, S3=0.19.
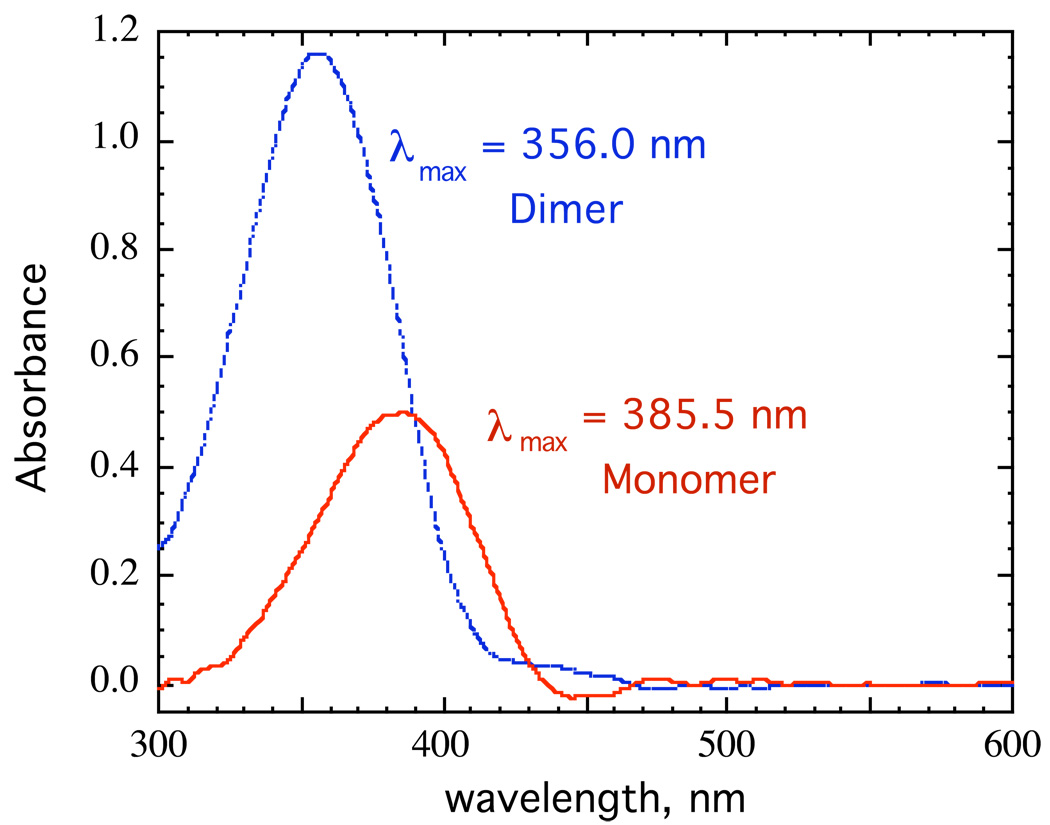
Spectra of the monomer and dimer of LiBiphCHX, the lithium enolate of 2-(p-biphenylyl)cyclohexanone, derived from the SVD analysis in Fig. 14.
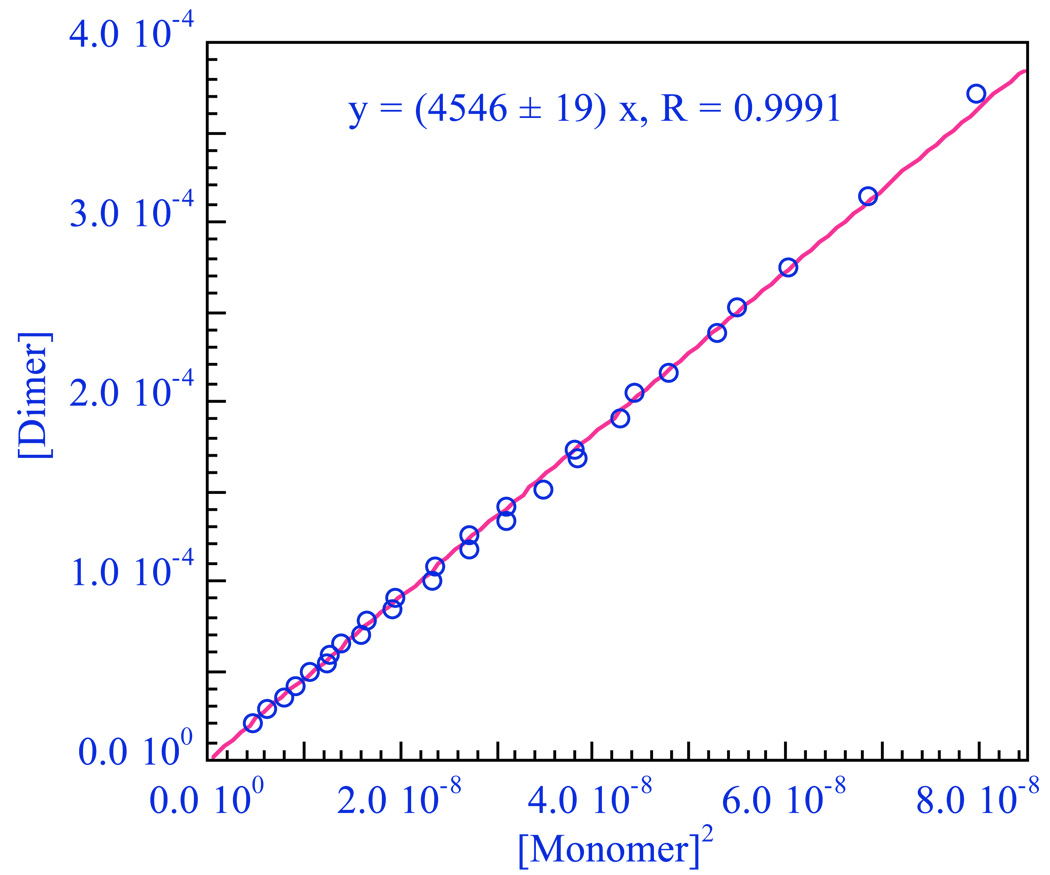
Plot of the concentration of the presumed dimer vs [monomer]2 to give a straight line whose slope is K1,2 = 4546 M−1.
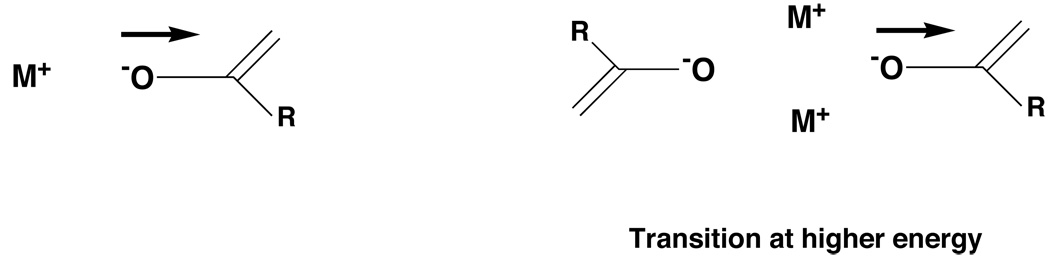
Monomer is at longer wavelength (lower energy).
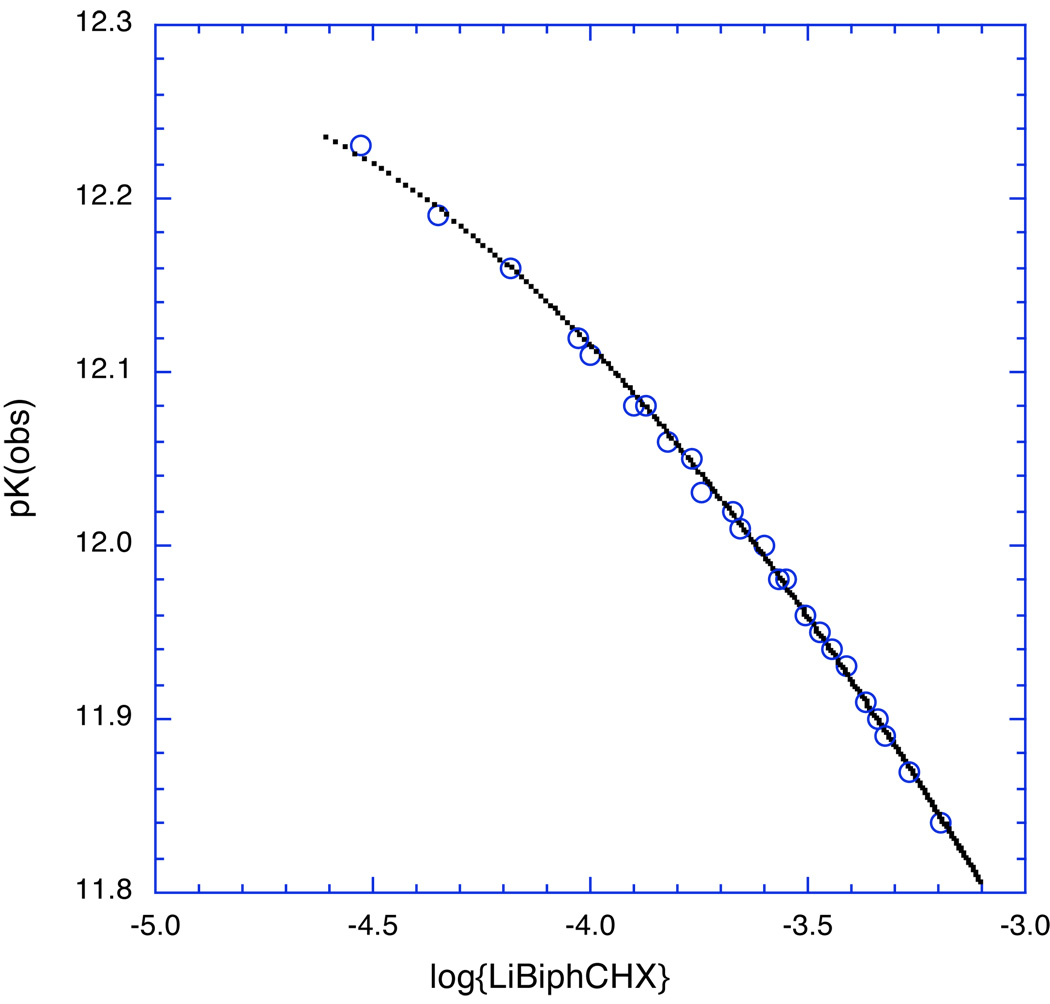
The observed pK of LiBiphCHX, the lithium enolate of 2-(p-biphenylyl)cyclohexanone, depends on the concentration. The black points are the theoretical pK’s for a monomer-dimer equilibrium with K1,2 = 4300 M−1.
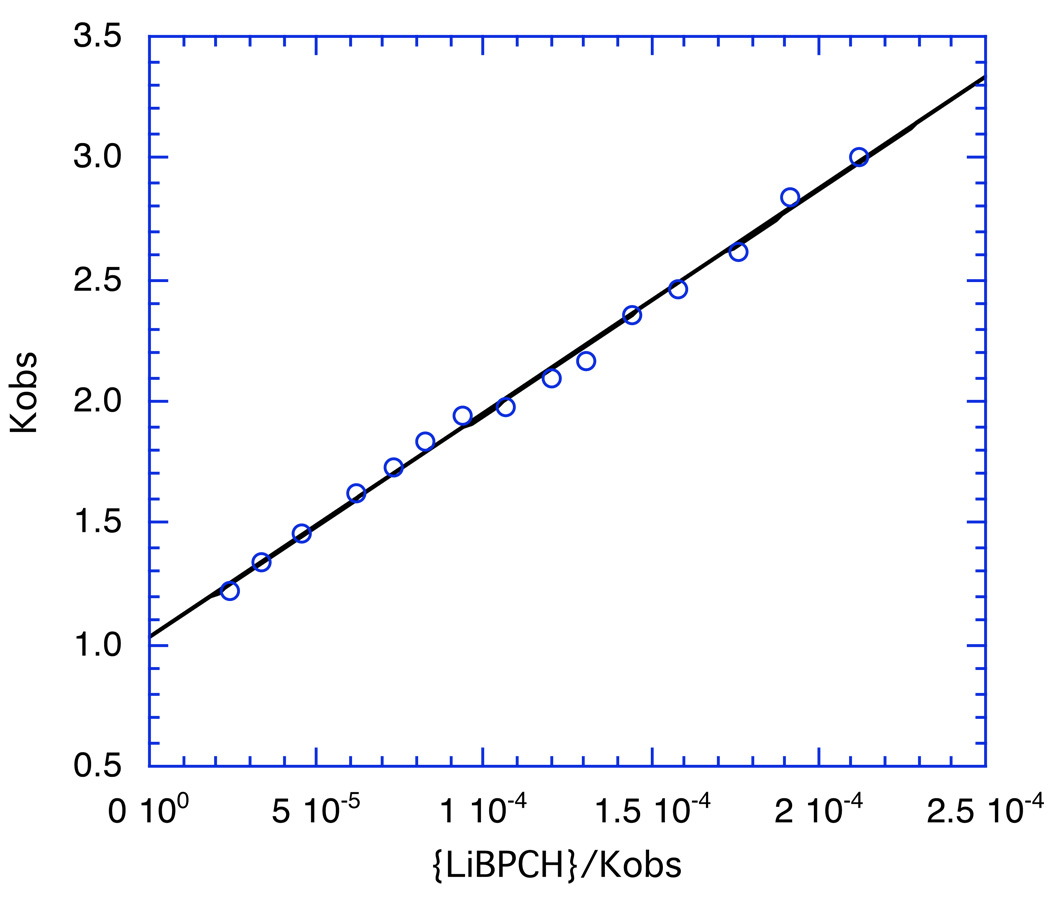
Plot of the data for the lithium enolate of 2-(p-biphenylyl)cyclohexanone, LiBPCH) according to eq. 7. The regression line shown is 1.029 ± 0.021 + (9202 ± 172)x; R2 = 0.995.
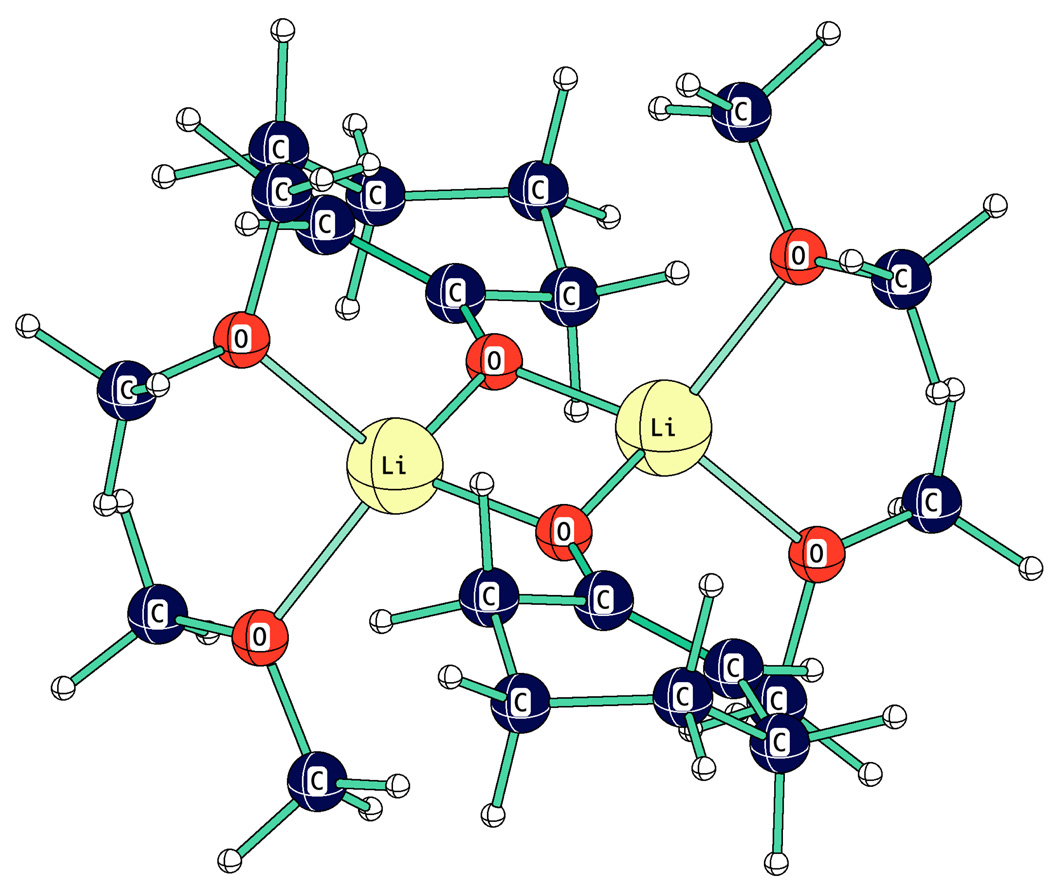
Dimer of a lithium enolate coordinated to four dimethyl ethers, HF 6–31+g*.
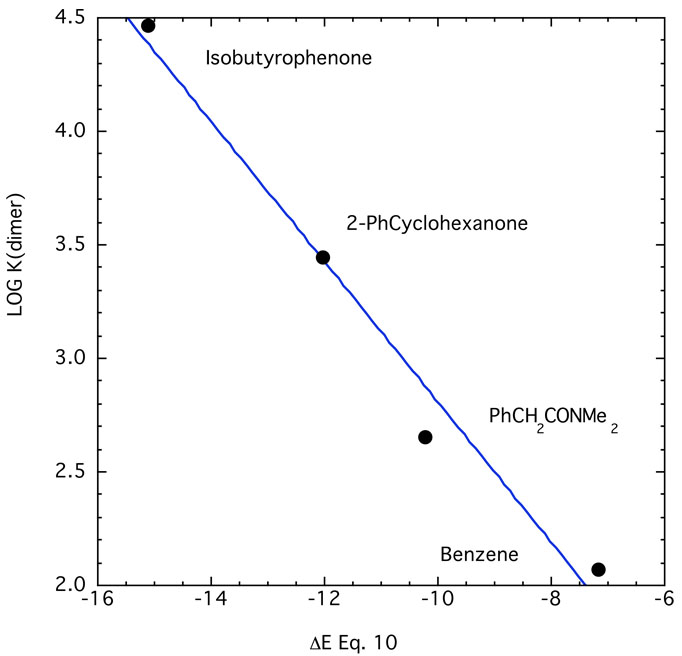
Comparison of log(dimerization constant) vs computed energies for eq. 10, 6–31+G*. Regression line shown is −0.28 ± 0.39 – (0.309 ± 0.034)x; R2 = 0.98.
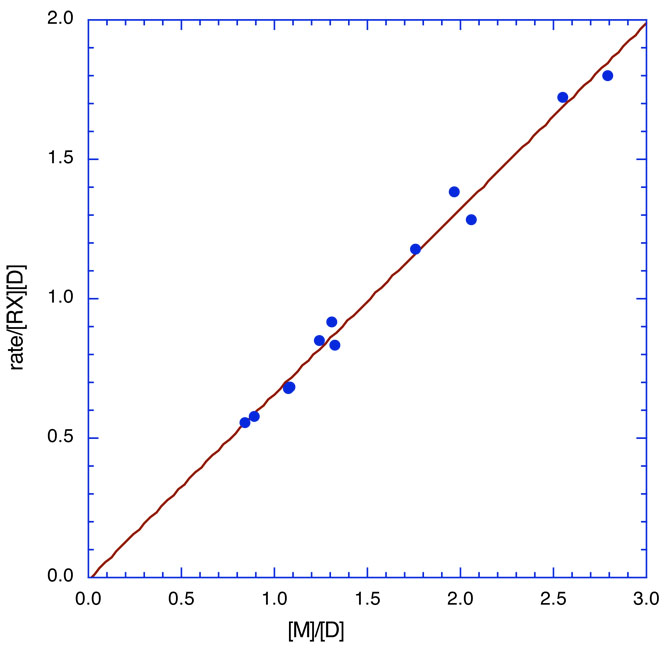
Kinetic results for the reaction of LiBiphCHX with o-methylbenzyl bromide. The regression line shown is: Rate/[RX][D] = −0.006 ± 0.039 + (0.664 ± 0.023)[M]; R2 = 0.988
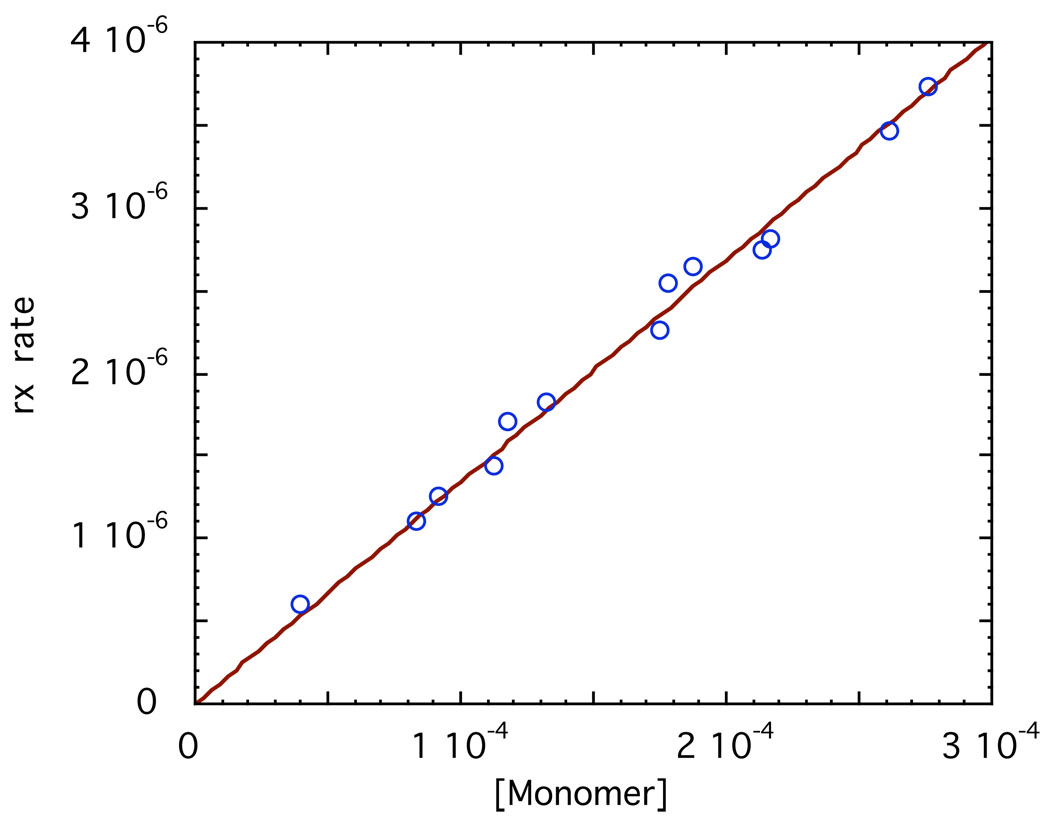
Plot of initial rate of reaction of 0.0205M o-methylbenzyl bromide vs monomer concn of LiBPCH. Slope of line through the origin is (13.4 ± 0.2) × 10−3; k2 = 0.655 M−1 s−1.
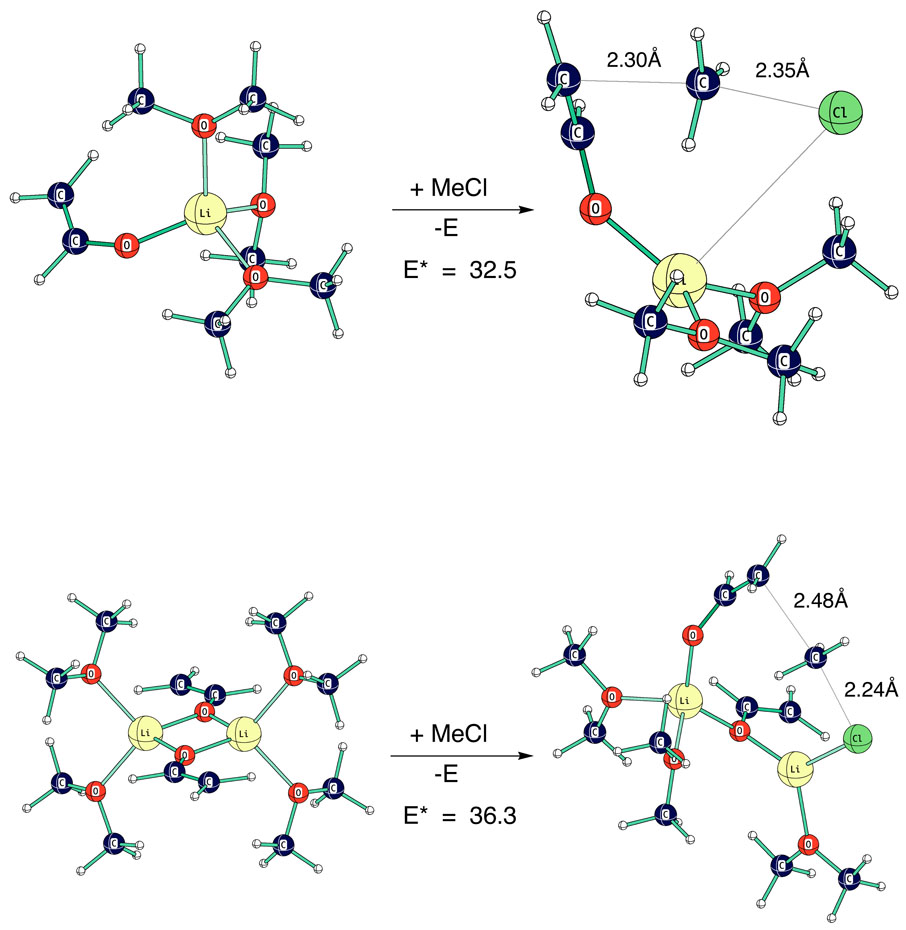
Computed transition structures (HF 6–31+g*) for reaction of lithium vinyloxide monomer (LiOV.3E) and dimer (2LiOV.4E) with methyl chloride.
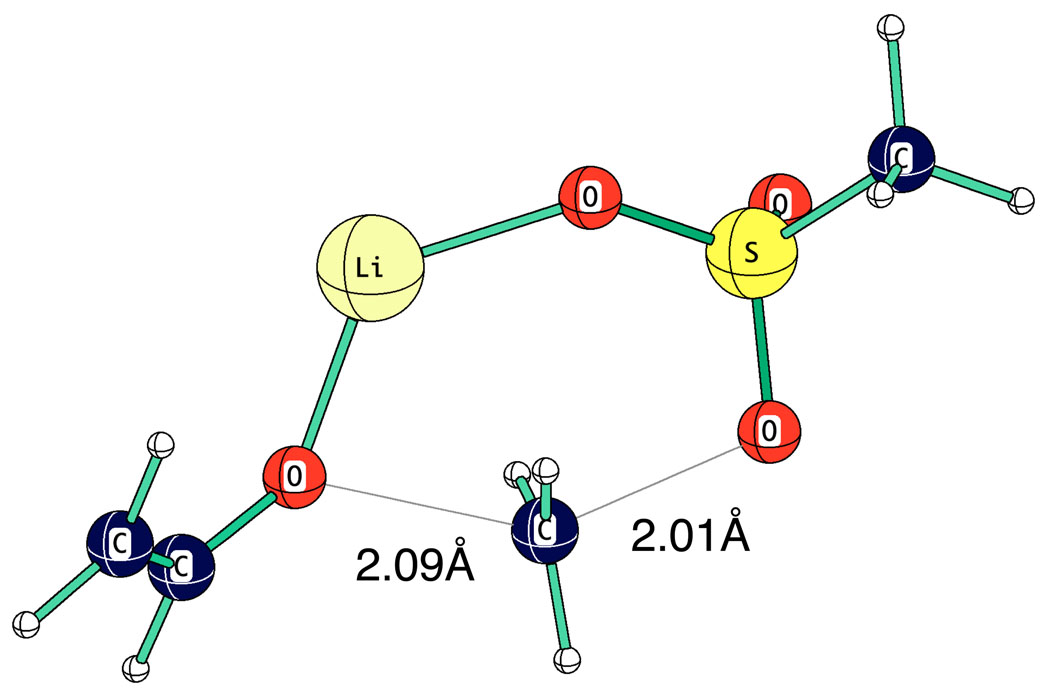
Computed TS for O-alkylation reaction of LiOV with methyl methanesulfonate.
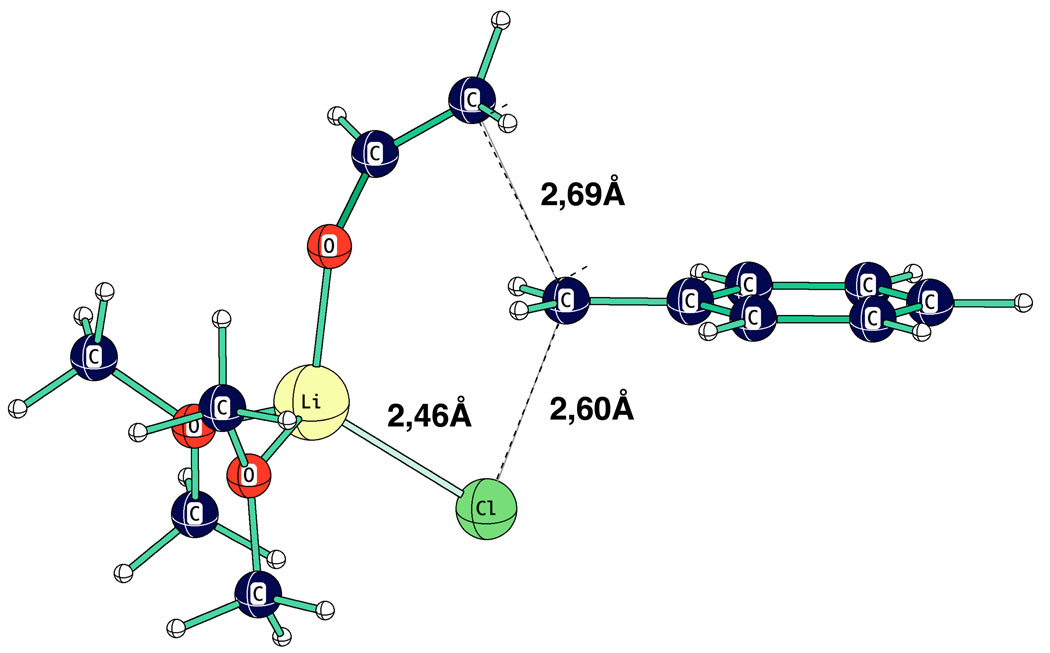
Computed TS (HF 6–31+G*) for reaction of lithium vinyloxide.2E with benzyl chloride.
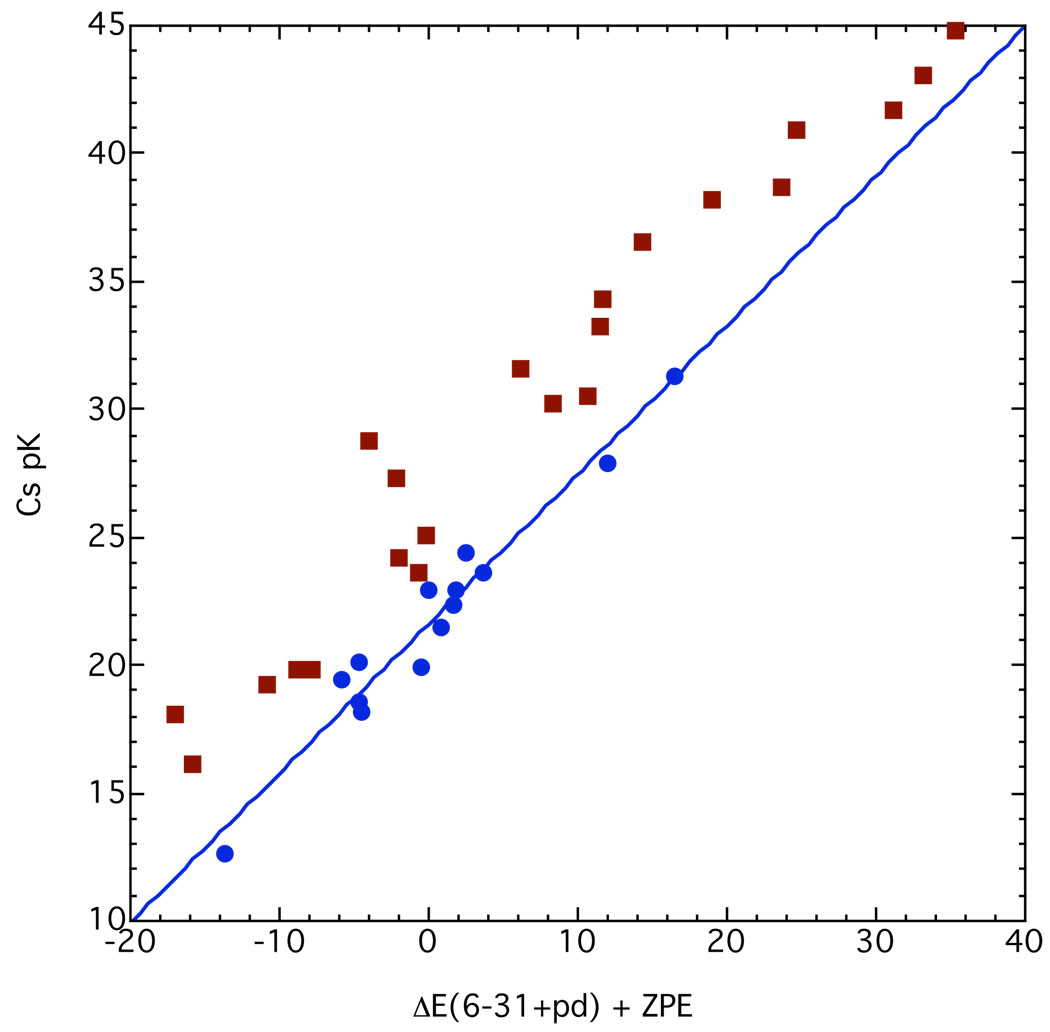
Cesium ion pair pK’s in THF compared to calculated energy changes without solvation. The regression line through the blue “standard” points is 21.61 ± 0.26 + (0.584 ± 0.036)x; R2 = 0.956.
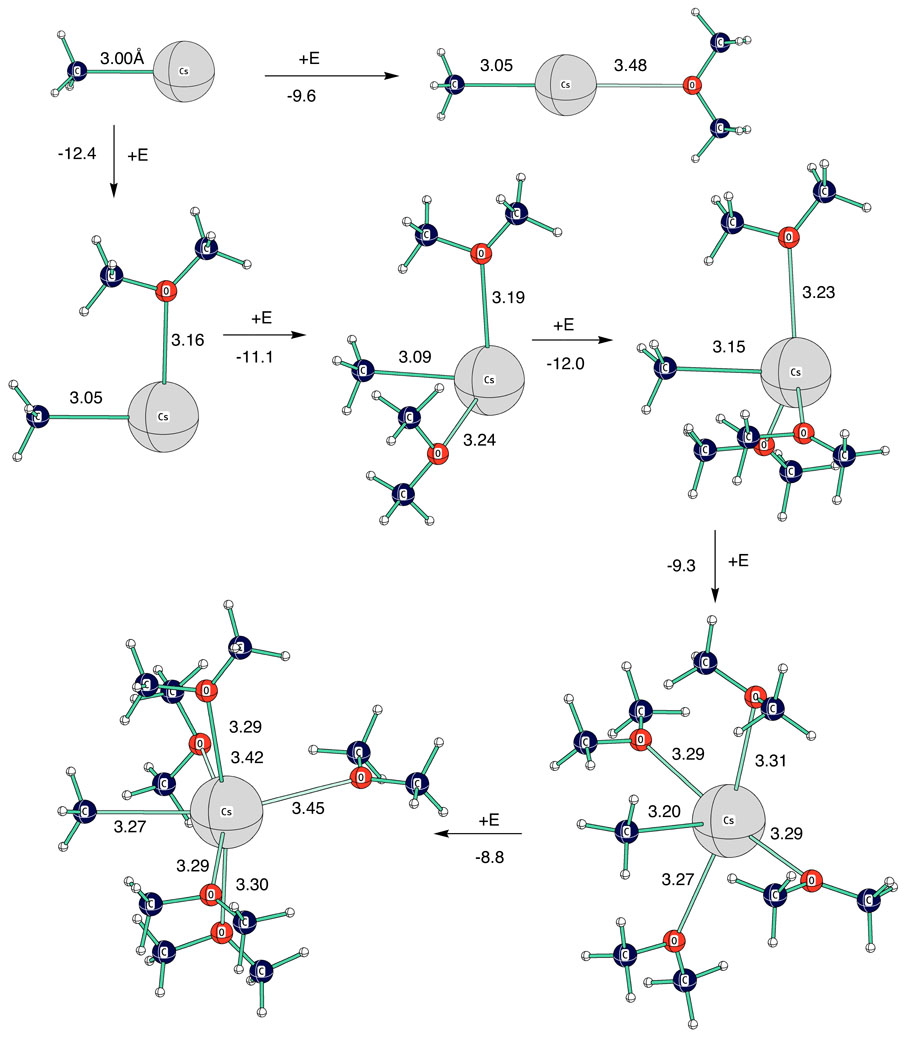
Successive coordinations of dimethyl ether (E) with methylcesium. Bond distances are given in Å, energy changes are Kcal mol−1 for HF 6–31+G** + ZPE.
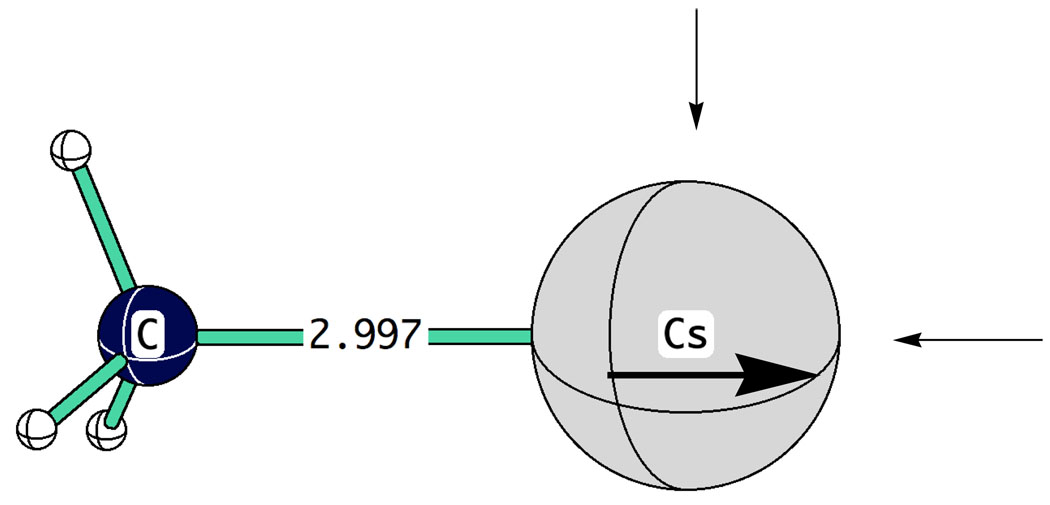
The polarization of cesium cation by methyl anion encourages coordination at right angles rather than at the terminal position.
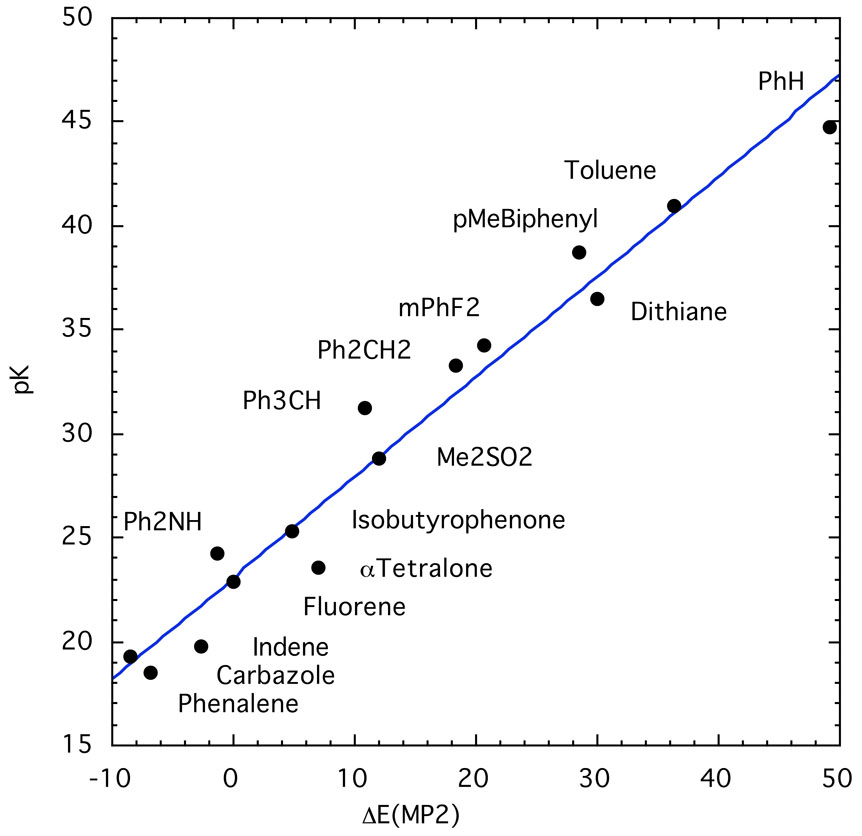
Cesium ion pair pK’s in THF compared to eq. 14 with energy differences in Kcal mol−1, MP2/6–31+G**. The regression line shown is 23.07 ± 0.57 + (0.483 ± 0.027)x; R2 = 0.962.
Similar articles
-
First-principle calculation of equilibrium cesium ion-pair acidities in tetrahydrofuran.J Am Chem Soc. 2007 Nov 7;129(44):13510-9. doi: 10.1021/ja073548f. Epub 2007 Oct 13. J Am Chem Soc. 2007. PMID: 17935326
-
Ion pair aggregates and reactions; experiment and theory.J Mol Model. 2006 Jul;12(5):673-80. doi: 10.1007/s00894-005-0045-3. Epub 2005 Dec 9. J Mol Model. 2006. PMID: 16341718
-
Ab initio modeling of organolithium equilibria.J Org Chem. 2010 Jun 4;75(11):3821-30. doi: 10.1021/jo100864y. J Org Chem. 2010. PMID: 20465266
-
Computational organic chemistry: bridging theory and experiment in establishing the mechanisms of chemical reactions.J Am Chem Soc. 2015 Feb 11;137(5):1706-25. doi: 10.1021/ja5112749. Epub 2015 Jan 27. J Am Chem Soc. 2015. PMID: 25568962 Review.
-
Chelation-controlled Bergman cyclization: synthesis and reactivity of enediynyl ligands.Chem Rev. 2003 Oct;103(10):4077-94. doi: 10.1021/cr020069k. Chem Rev. 2003. PMID: 14531718 Review. No abstract available.
Cited by
-
Sodium Diisopropylamide: Aggregation, Solvation, and Stability.J Am Chem Soc. 2017 Jun 14;139(23):7921-7930. doi: 10.1021/jacs.7b03061. Epub 2017 May 30. J Am Chem Soc. 2017. PMID: 28557426 Free PMC article.
-
Structure determination using the method of continuous variation: lithium phenolates solvated by protic and dipolar aprotic ligands.J Org Chem. 2013 Aug 2;78(15):7498-507. doi: 10.1021/jo401080n. Epub 2013 Jul 15. J Org Chem. 2013. PMID: 23806055 Free PMC article.
-
Solution structures of lithium amino alkoxides used in highly enantioselective 1,2-additions.J Am Chem Soc. 2014 Feb 19;136(7):2885-91. doi: 10.1021/ja412210d. Epub 2014 Feb 5. J Am Chem Soc. 2014. PMID: 24471766 Free PMC article.
-
Azaaldol condensation of a lithium enolate solvated by N,N,N',N'-tetramethylethylenediamine: dimer-based 1,2-addition to imines.J Am Chem Soc. 2013 Mar 13;135(10):4103-9. doi: 10.1021/ja400345c. Epub 2013 Mar 4. J Am Chem Soc. 2013. PMID: 23413774 Free PMC article.
-
Enediolate-dilithium amide mixed aggregates in the enantioselective alkylation of arylacetic acids: structural studies and a stereochemical model.J Am Chem Soc. 2013 Nov 13;135(45):16853-64. doi: 10.1021/ja403076u. Epub 2013 May 31. J Am Chem Soc. 2013. PMID: 23654300 Free PMC article.
References
-
- Streitwieser A, Jr, Jagow RH, Fahey RC, Suzuki S. J. Am. Chem. Soc. 1958;80:2326–2332.
-
- Streitwieser A., Jr J. Am. Chem. Soc. 1953;75:5014–5018.
-
- Charton M. Org. Prog. Phys. Chem. 1981;13:119.
-
- Anschütz R, Immendorff H. Ber. 1884;17:2816–2817.
-
- Heise R, Tö A. Ann. 1892;270:155–171.
Publication types
MeSH terms
Substances
Grants and funding
LinkOut - more resources
Full Text Sources
