. 2009 May;109(4):1179-91.
doi: 10.1111/j.1471-4159.2009.06055.x. Epub 2009 Mar 23.

Bioenergetic analysis of isolated cerebrocortical nerve terminals on a microgram scale: spare respiratory capacity and stochastic mitochondrial failure

Affiliations

Bioenergetic analysis of isolated cerebrocortical nerve terminals on a microgram scale: spare respiratory capacity and stochastic mitochondrial failure

Sung W Choi et al. J Neurochem. 2009 May.

Abstract

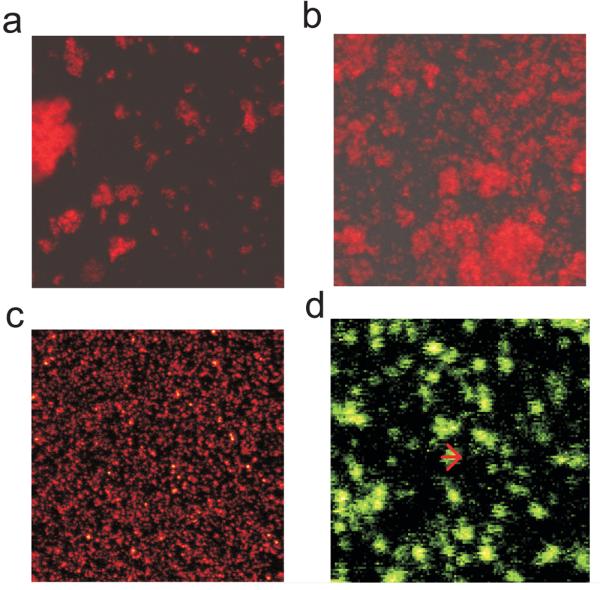
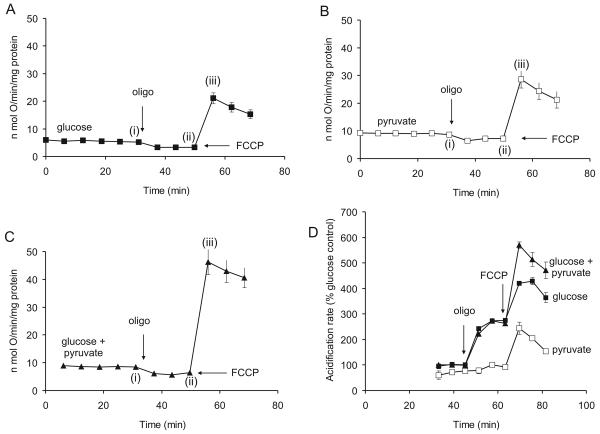
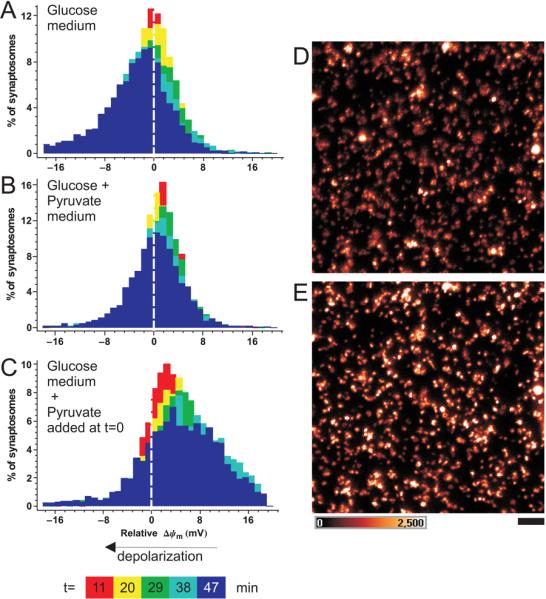
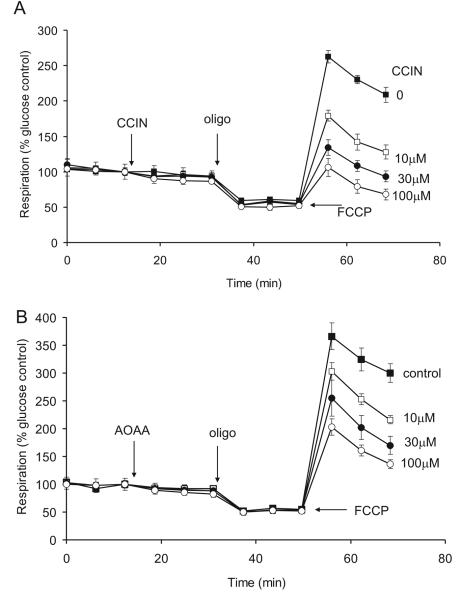
Pre-synaptic nerve terminals (synaptosomes) require ATP for neurotransmitter exocytosis and recovery and for ionic homeostasis, and are consequently abundantly furnished with mitochondria. Pre-synaptic mitochondrial dysfunction is implicated in a variety of neurodegenerative disorders, although there is no precise definition of the term 'dysfunction'. In this study, we test the hypothesis that partial restriction of electron transport through Complexes I and II in synaptosomes to mimic possible defects associated with Parkinson's and Huntington's diseases respectively, sensitizes individual terminals to mitochondrial depolarization under conditions of enhanced proton current utilization, even though these stresses are within the respiratory capacity of the synaptosomes when averaged over the entire population. We combine two novel techniques, firstly using a modification of a plate-based respiration and glycolysis assay that requires only microgram quantities of synaptosomal protein, and secondly developing an improved method for fluorescent imaging and statistical analysis of single synaptosomes. Conditions are defined for optimal substrate supply to the in situ mitochondria within mouse cerebrocortical synaptosomes, and the energetic demands of ion cycling and action-potential firing at the plasma membrane are additionally determined.


Figures

Fig. 1
Fig. 1
Confocal imaging of synaptosomes equilibrated with 50nM TMRM. Synaptosomes in ‘Ionic Medium’ were allowed to sediment under unit gravity (a) or by centrifugation at 3400g (b) for 60 min prior to imaging. (c) Synaptosomes in sucrose medium were centrifuged in parallel. The field size was 115 × 115μm. (d) Enlarged area from ‘c’. The density profile across a representative particle (arrow) gives a diameter of 1.8μm, typical for a synaptosome.
Fig. 2
Fig. 2
Basic respiratory parameters for cortical synaptosomes: ATP synthase inhibition and FCCP release of respiratory control. Substrates initially present were (A), 15mM glucose, (B) 10mM pyruvate or (C) 15mM glucose + 10mM pyruvate. Further additions were 4μg/ml oligomycin (oligo) and 4μM FCCP. Rates at the time-points (i) to (iii) are given in Table 1. (D) Rates of extra-cellular acidification determined in parallel with respiration; results are normalized to the acidification rate in glucose medium prior to addition of oligomycin.
Fig. 3
Fig. 3
Time-dependent changes in Δψm in individual synaptosomes: pyruvate causes a general, rather than selective, mitochondrial hyperpolarization. ‘Sucrose’ synaptosomes were equilibrated with 10nM TMRM+. (A-C) Colours represent histograms of the change in Δψm in individual synaptosomes, relative to t=0, sampled at the indicated times. Negative millivolts indicate relative depolarization. Synaptosomes in A and B were equilibrated with glucose and glucose+ pyruvate media respectively, while in C 10mM pyruvate was added to synaptosomes in glucose-only medium after the t=0 time-point. (D-E) false colour intensity image of before (D) and 38min after (E) addition of pyruvate to a field of synaptosomes in glucose-only medium. Scale bar 5μm, intensity scale is shown in arbitrary units of a 12-bit digitizer.
Fig. 4
Fig. 4
α-Cyanocinnamate and aminoxyacetate inhibition of FCCP-stimulated respiration. (A) 15mM glucose was present initially as substrate. Where indicated, 0-100μM α-cyanocinnamate (CCIN) was added followed by 4μg/ml oligomycin (oligo) and 4μM FCCP. (B) 0-100μM aminoxyacetate (AOAA) was added where indicated. In these and subsequent experiments respiration is calculated relative to basal respiration in glucose medium.
Fig. 5
Fig. 5
Veratridine enhancement of mitochondrial ATP turnover and inhibition of FCCP-stimulated respiration (A) in the presence and (B) in the absence of oligomycin. Synaptosomes were incubated in the presence of 15mM glucose + 10mM pyruvate. Where indicated veratridine (Vt, 0-5μM), oligomycin (oligo, 4μg/ml) and FCCP (4μM) were added. Rates are expressed relative to basal respiration in medium containing glucose but no pyruvate. (C, D) Corresponding relative acidification rates in the medium.
Fig. 6
Fig. 6
Ouabain and 4-aminopyridine enhance oligomycin-sensitive respiration. Synaptosomes were incubated in the presence of 15mM glucose + 10mM pyruvate. (A) Ouabain (0.3mM, open symbols) was added where indicated, followed by oligomycin (4μg/ml). (B) 4-aminopyridine (50μM, open squares or 1mM, circles) was added where indicated, followed by oligomycin (4μg/ml). Rates are expressed relative to basal respiration in medium containing glucose but no pyruvate.
Fig. 7
Fig. 7
Titration of basal, oligomycin-insensitive and FCCP-stimulated respiration with (A) rotenone and (B) 3-NPA. Synaptosomes were incubated in the presence of 15mM glucose + 10mM pyruvate and the indicated concentrations of inhibitors were added during the experiment. Rates are expressed relative to basal respiration in medium containing glucose but no pyruvate.
Fig. 8
Fig. 8
Decreased spare respiratory capacity by partial inhibition of Complex I or Complex II accelerates stochastic mitochondrial depolarization. Distribution of Δψm in individual synaptosomes. (A) control; (B) plus 150nM FCCP; (C) plus 10nM rotenone, (D) 10nM rotenone plus 150nM FCCP, (E) 200μM 3NPA (F) 200μM 3NPA plus 150nM FCCP. Colors code different time points after inhibitor addition, as indicated. Negative millivolts indicate the relative depolarization compared to the mean of the untreated control at the same time point. The line at −30mV depolarization represents the arbitrary threshold below which the mitochondria would be thermodynamically incapable of ATP generation.

Similar articles

Cited by

References

    1. Bambrick LL, Chandrasekaran K, Mehrabian Z, Wright C, Krueger BK, Fiskum G. Cyclosporin A increases mitochondrial calcium uptake capacity in cortical astrocytes but not cerebellar granule neurons. J Bioenerg. Biomembr. 2006;38:43–47. - PMC - PubMed
    1. Beal MF. Mitochondria take center stage in aging and neurodegeneration. Ann. Neurol. 2005;58:495–505. - PubMed
    1. Betarbet R, Canet-Aviles RM, Sherer TB, Mastroberardino PG, McLendon C, Kim JH, Lund S, Na HM, Taylor G, Bence NF, Kopito R, Seo BB, Yagi T, Yagi A, Klinefelter G, Cookson MR, Greenamyre JT. Intersecting pathways to neurodegeneration in Parkinson's disease: effects of the pesticide rotenone on DJ-1, alpha-synuclein, and the ubiquitin-proteasome system. Neurobiol. Dis. 2006;22:404–420. - PubMed
    1. Brand MD. The efficiency and plasticity of mitochondrial energy transduction. Biochem. Soc. Trans. 2005;33:897–904. - PubMed
    1. Browne SE, Beal MF. The energetics of Huntington's disease. Neurochem. Res. 2004;29:531–546. - PubMed

Publication types

MeSH terms