Review
. 2010 Jan;50(1):20-5.
doi: 10.1016/j.ymeth.2009.05.016. Epub 2009 Jun 9.

In vivo micro-CT imaging of liver lesions in small animal models

Affiliations
Review

In vivo micro-CT imaging of liver lesions in small animal models

Lucia Martiniova et al. Methods. 2010 Jan.

Abstract

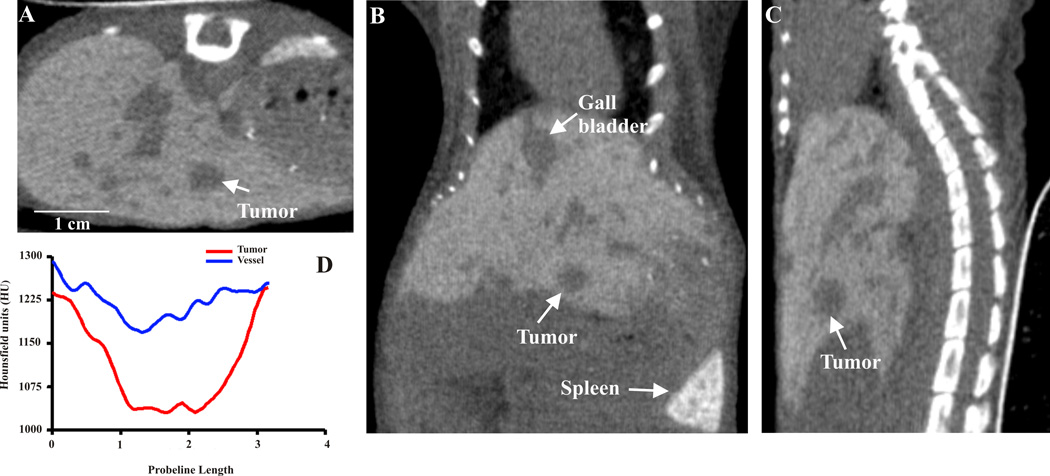
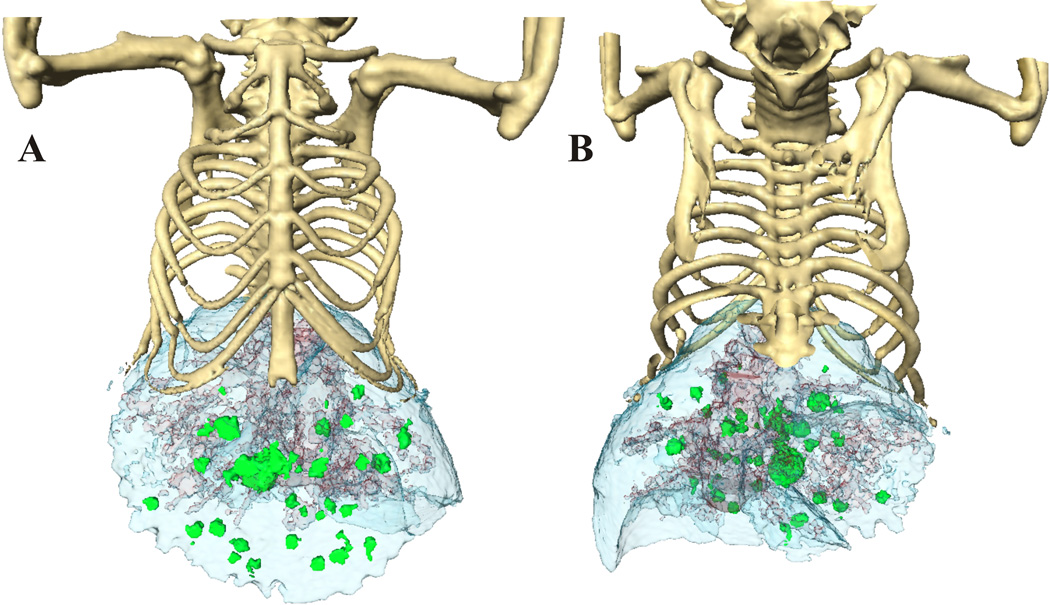
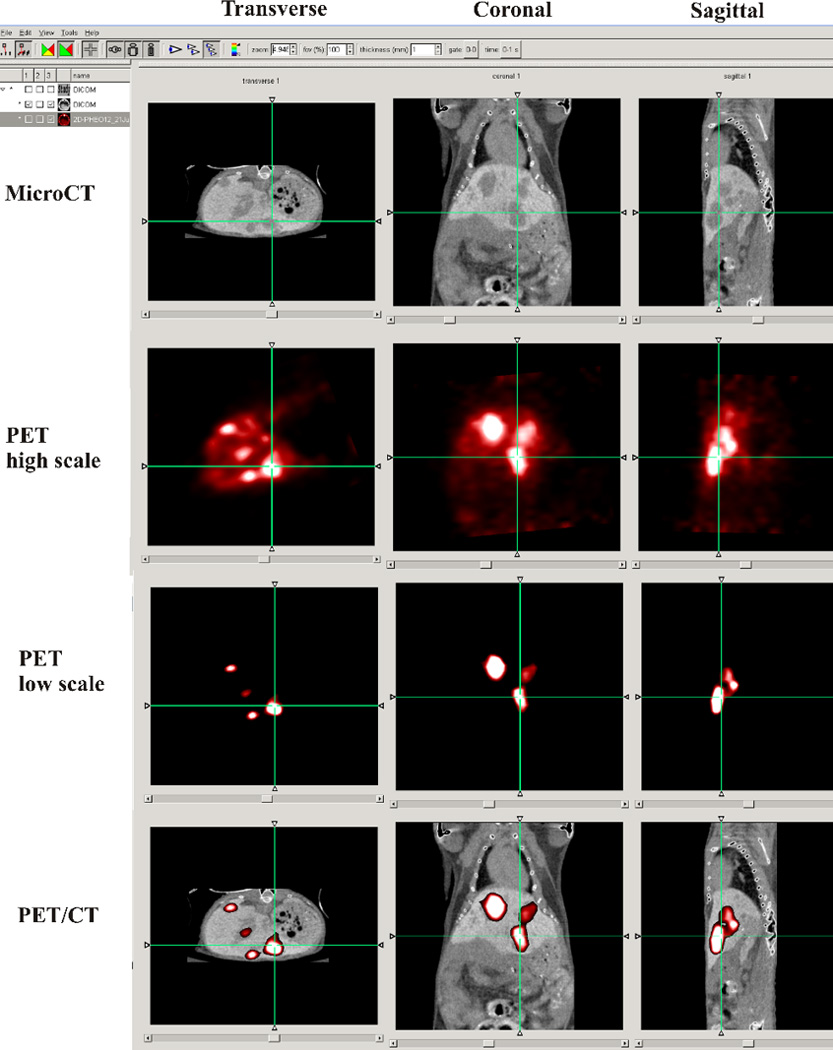
Three-dimensional micro computed tomography (microCT) offers the opportunity to capture images liver structures and lesions in mice with a high spatial resolution. Non-invasive microCT allows for accurate calculation of vessel tortuosity and density, as well as liver lesion volume and distribution. Longitudinal monitoring of liver lesions is also possible. However, distinguishing liver lesions from variations within a normal liver is impossible by microCT without the use of liver- or tumor-specific contrast-enhancing agents. The combination of microCT for morphologic imaging with functional imaging, such as positron emission tomography (PET) or single photon emission tomography (SPECT), offers the opportunity for better abdominal imaging and assessment of structure discrepancies visible by functional imaging. This paper describes methods of current microCT imaging options for imaging of liver lesions compared to other imaging techniques in small animals.


Figures

Fig. 1
Fig. 1
Micro computed tomography (CT) images acquired after hepatocyte-specific contrast (Fenestra™ LC) 3 hours post injection. Transverse (A), coronal (B), and sagittal (C) views of the abdomen in a nude mouse with developed liver lesions. The arrow points to the same lesions in all views. Line-profile data (D) visualizing the liver parenchyma (1220–1240 HU) – trough liver tumor (1025–1060 HU) in contrast to the vasculature (1170–1300 HU).
Fig. 2
Fig. 2
The anterior (A) and posterior image (B) surface-rendered images of mouse with liver lesions after 3 hours of contrast enhancement. The lobes of liver (blue) are well defined, as well as the vasculature in it. Due to the different contrast enhancement and HU, we were able to separate the liver tumors (green) from the liver vessels (red).
Fig. 3
Fig. 3
MicroCT/PET fusion was performed in AMIDE software. MicroCT scan with the liver contras agent was performed as descried in section 2.6. PET acquisition were performed on Advanced Technology Laboratory Animal Scanner (ATLAS) scanner 60 min after administering 3.5–3.9 MBq of [18F]-6F–Dopamine. The PET image is presented with two different brightness scale as low and high for better visualization of the all body of the animal with [18F]-6F–Dopamine PET. The microPET scan was performed on ATLAS scanner 1 day after the microCT. The crosshairs linking of the axial, coronal, and sagittal reformatted images, visualize of the same liver lesion on microCT and PET.

References

    1. Guy CT, Webster MA, Schaller M, Parsons TJ, Cardiff RD, Muller WJ. Proc Natl Acad Sci U S A. 1992;89:10578–10582. - PMC - PubMed
    1. Lin SC, Lee KF, Nikitin AY, Hilsenbeck SG, Cardiff RD, Li A, Kang KW, Frank SA, Lee WH, Lee EY. Cancer Res. 2004;64:3525–3532. - PubMed
    1. An Z, Jiang P, Wang X, Moossa AR, Hoffman RM. Clin Exp Metastasis. 1999;17:265–270. - PubMed
    1. Hoffman RM. Invest New Drugs. 1999;17:343–359. - PubMed
    1. Minn AJ, Gupta GP, Siegel PM, Bos PD, Shu W, Giri DD, Viale A, Olshen AB, Gerald WL, Massague J. Nature. 2005;436:518–524. - PMC - PubMed

Publication types