

In vivo diffusion tensor imaging of the human optic chiasm at sub-millimeter resolution
- PMID: 19520170
- PMCID: PMC2735123
- DOI: 10.1016/j.neuroimage.2009.05.098
In vivo diffusion tensor imaging of the human optic chiasm at sub-millimeter resolution
Abstract
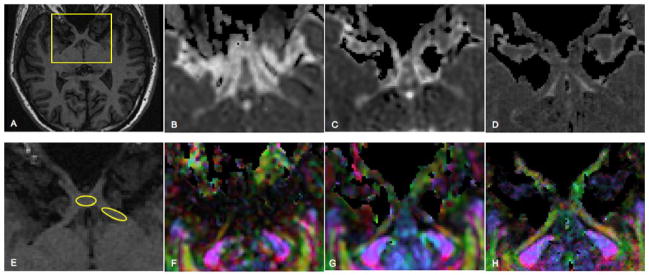
In this work we report findings from an in vivo diffusion tensor imaging (DTI) study of the human optic chiasm at sub-millimeter voxel resolution. Data were collected at 3 T using a diffusion-weighted radial-FSE sequence, which provides images free from typical magnetic susceptibility artifacts. The general DTI features observed in the optic chiasm region were consistent across subjects. They included a central area with high anisotropy and highest diffusivity in a predominately right/left direction corresponding to the decussation of nasal hemiretinae fibers, surrounded by a band of low anisotropy reflecting heterogeneous orientation of fibers within the voxel, and a lateral area with high anisotropy and highest diffusivity in a predominately anterior/posterior direction corresponding to temporal hemiretinae fibers that do not cross. Animal studies indicate that there is a significant dorsal-ventral reorganization of the retinotopic distribution of fibers along the optic pathways. We found that diffusion ellipsoids in the central portion of the optic chiasm show considerable planar anisotropy in the coronal plane indicating fiber crossings in the superior/inferior direction, rather than strictly right/left. This architectural feature of the chiasm suggests that dorso-ventral reorganization of fibers in the optic pathways also occurs in humans. We have shown that by collecting sub-millimeter resolution data, DTI can be used to investigate fine details of small and complex white matter structures, in vivo, with a clinical scanner. High spatial resolution, however, is necessary in the slice direction as well as in-plane to reduce the CSF contribution to the signal and to increase fiber coherence within voxels.
Figures


Similar articles
-
High-resolution diffusion tensor imaging and tractography of the human optic chiasm at 9.4 T.Neuroimage. 2008 Jan 1;39(1):157-68. doi: 10.1016/j.neuroimage.2007.08.015. Epub 2007 Aug 24. Neuroimage. 2008. PMID: 17936015
-
Preliminary experience with visualization of intracortical fibers by focused high-resolution diffusion tensor imaging.AJNR Am J Neuroradiol. 2008 Jan;29(1):146-50. doi: 10.3174/ajnr.A0742. Epub 2007 Oct 18. AJNR Am J Neuroradiol. 2008. PMID: 17947372 Free PMC article.
-
Diffusion anisotropy measurement of brain white matter is affected by voxel size: underestimation occurs in areas with crossing fibers.AJNR Am J Neuroradiol. 2007 Jun-Jul;28(6):1102-6. doi: 10.3174/ajnr.A0488. AJNR Am J Neuroradiol. 2007. PMID: 17569968 Free PMC article.
-
A practical approach to in vivo high-resolution diffusion tensor imaging of rhesus monkeys on a 3-T human scanner.Magn Reson Imaging. 2009 Apr;27(3):335-46. doi: 10.1016/j.mri.2008.07.004. Epub 2008 Sep 2. Magn Reson Imaging. 2009. PMID: 18768280
-
High resolution diffusion-weighted imaging in fixed human brain using diffusion-weighted steady state free precession.Neuroimage. 2009 Jul 1;46(3):775-85. doi: 10.1016/j.neuroimage.2009.01.008. Epub 2009 Jan 22. Neuroimage. 2009. PMID: 19344686
Cited by
-
Decussating axons segregate within the anterior core of the primate optic chiasm.Br J Ophthalmol. 2023 Apr;107(4):447-452. doi: 10.1136/bjo-2022-322235. Epub 2022 Dec 5. Br J Ophthalmol. 2023. PMID: 36575620 Free PMC article. Review.
-
Diffusion tensor imaging of the optic nerve in multiple sclerosis: association with retinal damage and visual disability.AJNR Am J Neuroradiol. 2011 Oct;32(9):1662-8. doi: 10.3174/ajnr.A2574. Epub 2011 Jul 28. AJNR Am J Neuroradiol. 2011. PMID: 21799043 Free PMC article. Clinical Trial.
-
Extremely efficient and deterministic approach to generating optimal ordering of diffusion MRI measurements.Med Phys. 2011 Aug;38(8):4795-801. doi: 10.1118/1.3615163. Med Phys. 2011. PMID: 21928652 Free PMC article.
-
Nerve fibre organisation in the human optic nerve and chiasm: what do we really know?Eye (Lond). 2024 Aug;38(12):2457-2471. doi: 10.1038/s41433-024-03137-7. Epub 2024 Jun 7. Eye (Lond). 2024. PMID: 38849598 Free PMC article. Review.
-
Relating diffusion tensor imaging measurements to microstructural quantities in the cerebral cortex in multiple sclerosis.Hum Brain Mapp. 2019 Oct 15;40(15):4417-4431. doi: 10.1002/hbm.24711. Epub 2019 Jul 29. Hum Brain Mapp. 2019. PMID: 31355989 Free PMC article.
References
-
- Alexander AL, Hasan KM, et al. Analysis of partial volume effects in diffusion-tensor MRI. Magnetic Resonance in Medicine. 2001;45(5):770–780. - PubMed
-
- Assaf Y, Freidlin RZ, et al. New modeling and experimental framework to characterize hindered and restricted water diffusion in brain white matter. Magnetic Resonance in Medicine. 2004;52(5):965–978. - PubMed
-
- Basser PJ, Mattiello J, et al. Estimation of the Effective Self-Diffusion Tensor from the Nmr Spin-Echo. Journal of Magnetic Resonance Series B. 1994;103(3):247–254. - PubMed
-
- Basser PJ, Pajevic S. Statistical artifacts in diffusion tensor MRI (DT-MRI) caused by background noise. Magnetic Resonance in Medicine. 2000;44(1):41–50. - PubMed
-
- Basser PJ, Pierpaoli C. Microstructural and physiological features of tissues elucidated by quantitative-diffusion-tensor MRI. Journal of Magnetic Resonance Series B. 1996;111(3):209–219. - PubMed
Publication types
MeSH terms
Grants and funding
LinkOut - more resources
Full Text Sources
Other Literature Sources
