. 2009 Oct 15;48(1):117-25.
doi: 10.1016/j.neuroimage.2009.05.097. Epub 2009 Jun 9.

Functional but not structural changes associated with learning: an exploration of longitudinal voxel-based morphometry (VBM)

Affiliations

Functional but not structural changes associated with learning: an exploration of longitudinal voxel-based morphometry (VBM)

Adam G Thomas et al. Neuroimage. .

Abstract

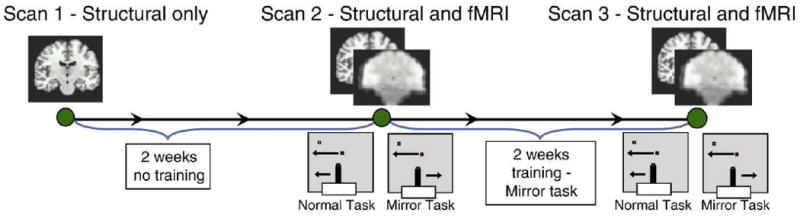
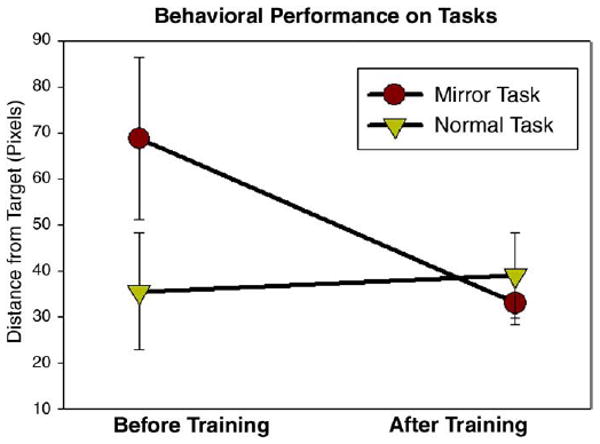
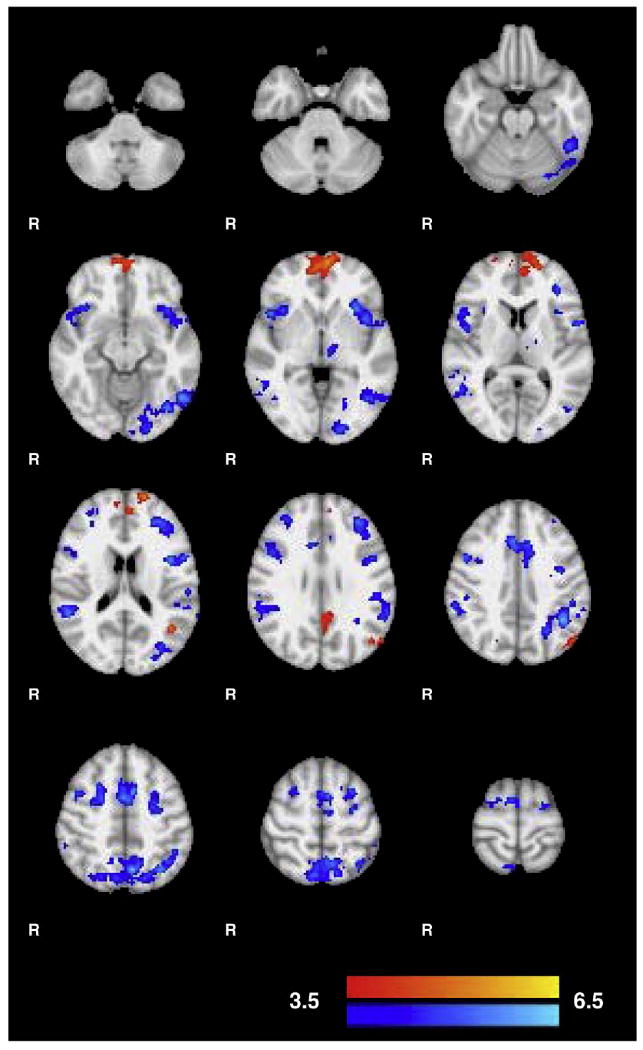
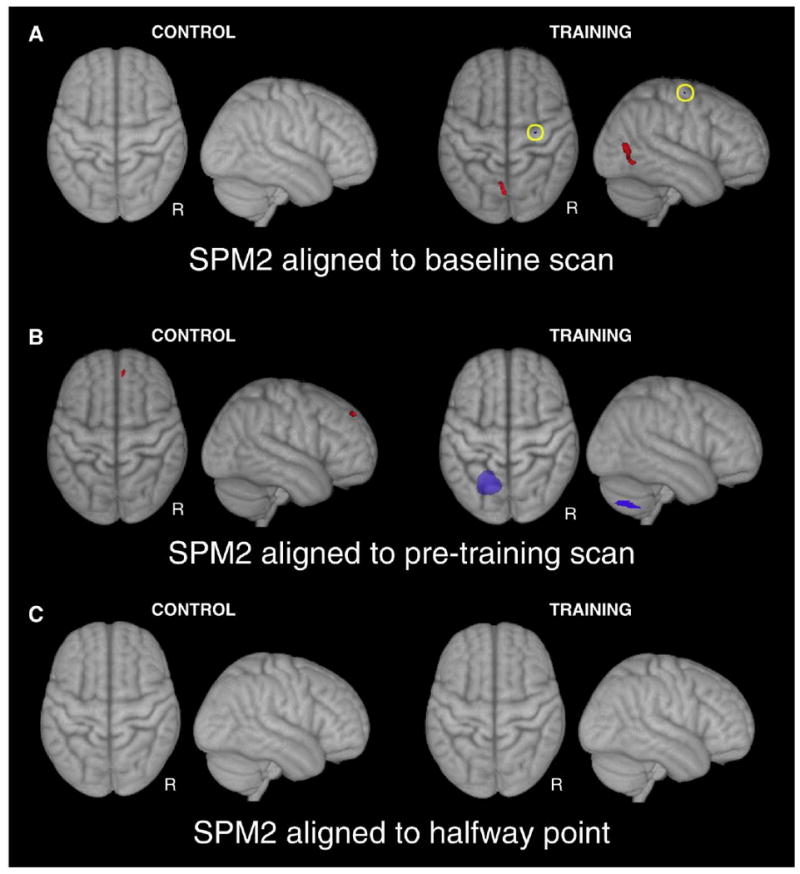
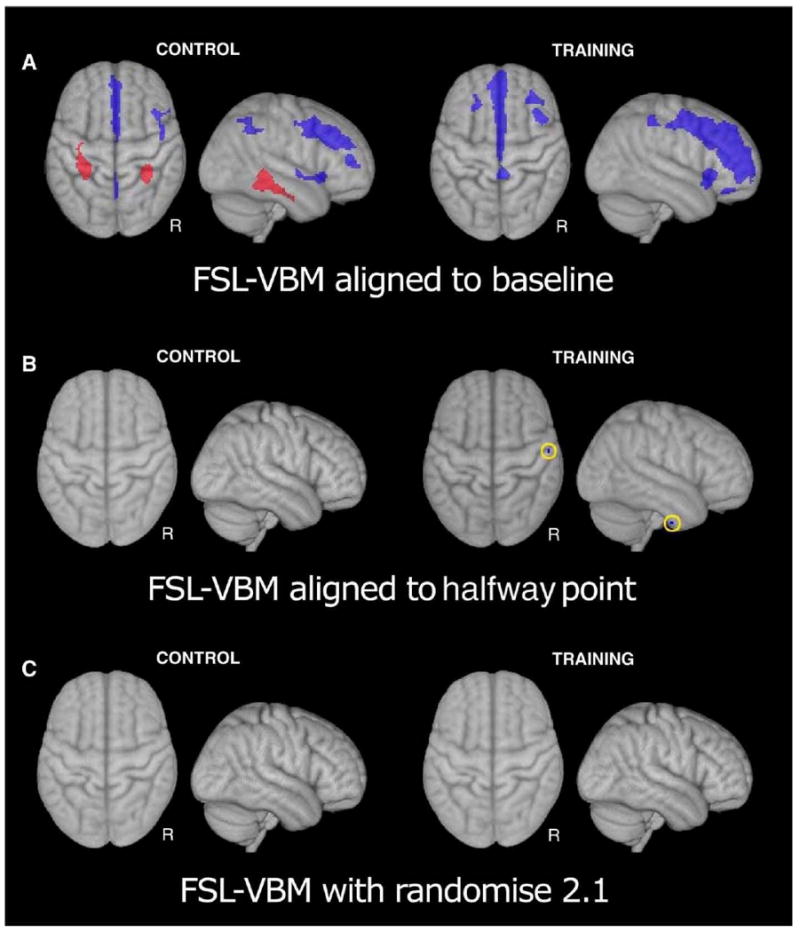
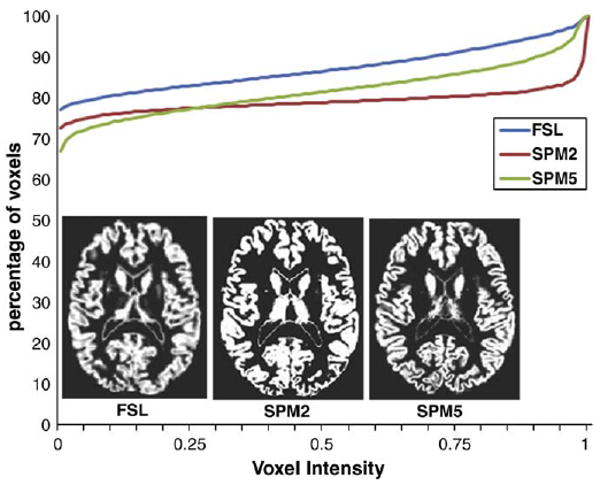
Voxel-Based Morphometry (VBM) has been used for several years to study differences in brain structure between populations. Recently, a longitudinal version of VBM has been used to show changes in gray matter associated with relatively short periods of training. In the present study we use fMRI and three different standard implementations of longitudinal VBM: SPM2, FSL, and SPM5 to assess functional and structural changes associated with a simple learning task. Behavioral and fMRI data clearly showed a significant learning effect. However, initially positive VBM results were found to be inconsistent across minor perturbations of the analysis technique and ultimately proved to be artifactual. When alignment biases were controlled for and recommended statistical procedures were used, no significant changes in grey matter density were found. This work, initially intended to show structural and functional changes with learning, rather demonstrates some of the potential pitfalls of existing longitudinal VBM methods and prescribes that these tools be applied and interpreted with extreme caution.


Figures

Fig. 1
Fig. 1
Subjects initially underwent a baseline structural MRI scan (scan 1). After a two-week control period the subjects underwent a second structural MRI scan (scan 2) as well as four fMRI scans during which they alternated performing the mirror task and the control task. The control task required the subject to follow a randomly moving white dot on the screen using a joystick held in the right hand. The mirror task was identical to the control task except that the left–right axis of the joystick is reversed. After scan 2, subjects were trained on the mirror task for a total of 2.5 h over 2 weeks (six 25-minute training sessions). At the end of the training subjects received both structural and functional MRI scans identical to scan 2.
Fig. 2
Fig. 2
All subjects significantly improved on the mirror-tracking task as measured by average distance of the joystick cursor from the tracking dot (paired T-test, p<0.0001). For the normal tracking task there was no significant difference in cursor distance before and after training (p = 0.52).
Fig. 3
Fig. 3
Clusters of increased and decreased activation after training on the mirror-tracking task. Z-stats of increased activity are shown in red and decreased activity in blue. Areas of decreased activity include task specific regions such as the middle frontal gyrus and posterior parietal cortex. Increased functional activity occurred primarily in the medial frontal cortex which has been implicated in response inhibition and the resting state network. Clusters are overlaid on the MNI152. See Table 1 for a list of all clusters.
Fig. 4
Fig. 4
Maximum intensity projections of gray matter increases (red) and decreases (blue) found in the SPM2 VBM analyses. Background image is the MNI152 3D rendered in AFNI (Cox, 1996). Clusters of grey matter changes found with scans aligned to the baseline session (A) were not consistent with clusters found when scans were aligned to the pre-training session (B). (C) When scans were aligned to a halfway point between the two scans no structural changes were found. See Supplemental Table 1 for a list of areas and coordinates.
Fig. 5
Fig. 5
Maximum intensity projection of regions of gray matter change in the FSL-VBM analyses. Clusters of grey matter change found when scans were aligned to the first session (A) were not found when scans were aligned to a halfway point between scans 1 and 2 (B). C) Corrections to the FSL permutation procedure eliminated all significant clusters of grey matter change. See Supplemental Table 1 for a list of areas and coordinates.
Fig. 6
Fig. 6
Comparison of a single subject's segmented gray matter images between FSL, SPM2 and SPM5. The line graph shows cumulative percentage of pixels as a function of voxel intensity. SPM2 produces a segmented image with a harder edge and many more voxels assigned to an intensity value of 1 (i.e. 100% gray matter). The FSL (FAST) segmentation produces a more uniform distribution of intensity values with softer edges. SPM5 falls between these two extremes. Virtually identical histograms were produced when the source images were rigidly aligned and interpolated.

Similar articles

Cited by

References

    1. Ashburner J, Friston KJ. Voxel-based morphometry—the methods. NeuroImage. 2000;11:805–821. - PubMed
    1. Ashburner J, Friston KJ. Why voxel-based morphometry should be used. NeuroImage. 2001;14:1238–1243. - PubMed
    1. Ashburner J, Friston KJ. Unified segmentation. NeuroImage. 2005;26:839–851. - PubMed
    1. Beckmann CF, Jenkinson M, Smith SM. General multilevel linear modeling for group analysis in FMRI. NeuroImage. 2003;20:1052–1063. - PubMed
    1. Black JE, Isaacs KR, Anderson BJ, Alcantara AA, Greenough WT. Learning causes synaptogenesis, whereas motor activity causes angiogenesis, in cerebellar cortex of adult rats. Proc Natl Acad Sci U S A. 1990;87:5568–5572. - PMC - PubMed

Publication types

LinkOut - more resources