

Hemodynamic nonlinearities affect BOLD fMRI response timing and amplitude
- PMID: 19520175
- PMCID: PMC2731556
- DOI: 10.1016/j.neuroimage.2009.06.001
Hemodynamic nonlinearities affect BOLD fMRI response timing and amplitude
Abstract
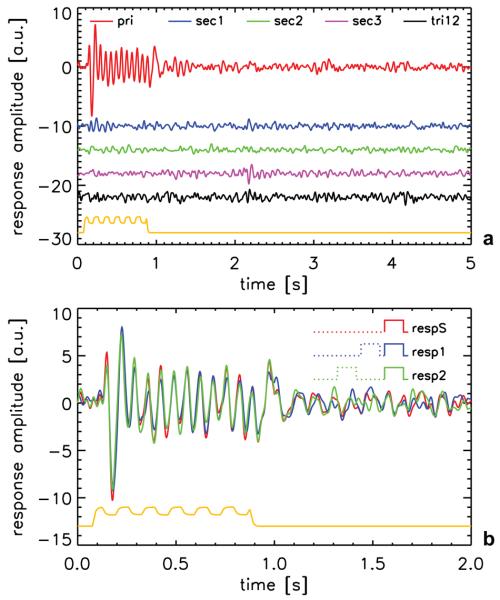
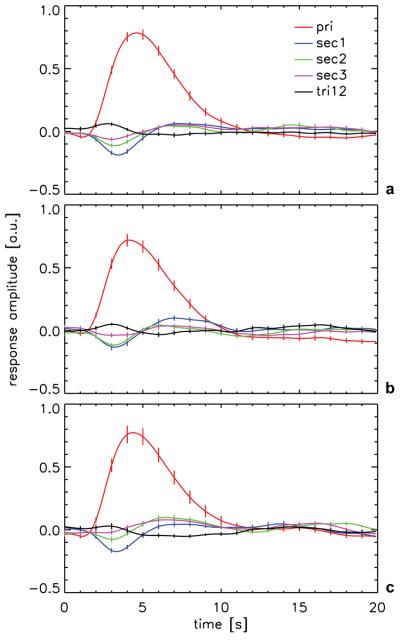
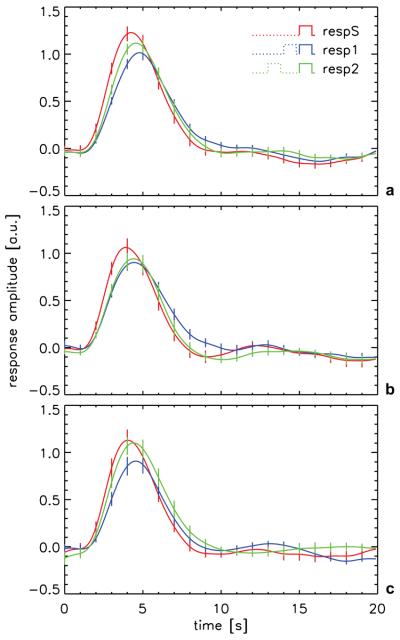
The interpretation of functional magnetic resonance imaging (fMRI) studies based on blood oxygen-level dependent (BOLD) contrast generally relies on the assumption of a linear relationship between evoked neuronal activity and fMRI response. While nonlinearities in this relationship have been suggested by a number of studies, it remains unclear to what extent they relate to the neurovascular response and are therefore inherent to BOLD fMRI. Full characterization of potential vascular nonlinearities is required for accurate inferences about the neuronal system under study. To investigate the extent of vascular nonlinearities, evoked activity was studied in humans with BOLD fMRI (n=28) and magnetoencephalography (MEG) (n=5). Brief (600-800 ms) rapidly repeated (1 Hz) visual stimuli were delivered using a stimulation paradigm that minimized neuronal nonlinearities. Nevertheless, BOLD fMRI experiments showed substantial remaining nonlinearities. The smallest stimulus separation (200-400 ms) resulted in significant response broadening (15-20% amplitude decrease; 10-12% latency increase; 6-14% duration increase) with respect to a linear prediction. The substantial slowing and widening of the response in the presence of preceding stimuli suggest a vascular rather than neuronal origin to the observed nonlinearity. This was confirmed by the MEG data, which showed no significant neuro-electric nonlinear interactions between stimuli as little as 200 ms apart. The presence of substantial vascular nonlinearities has important implications for rapid event-related studies by fMRI and other imaging modalities that infer neuronal activity from hemodynamic parameters.
Figures
Similar articles
-
Accounting for nonlinear BOLD effects in fMRI: parameter estimates and a model for prediction in rapid event-related studies.Neuroimage. 2005 Mar;25(1):206-18. doi: 10.1016/j.neuroimage.2004.11.008. Epub 2005 Jan 4. Neuroimage. 2005. PMID: 15734356
-
The effect of stimulus duty cycle and "off" duration on BOLD response linearity.Neuroimage. 2005 Aug 1;27(1):70-82. doi: 10.1016/j.neuroimage.2005.03.040. Neuroimage. 2005. PMID: 15914032 Clinical Trial.
-
Linear coupling of undershoot with BOLD response in ER-fMRI and nonlinear BOLD response in rapid-presentation ER-fMRI.Neuroimage. 2011 Jul 15;57(2):391-402. doi: 10.1016/j.neuroimage.2011.04.067. Epub 2011 May 7. Neuroimage. 2011. PMID: 21575729 Free PMC article.
-
Technical considerations for functional magnetic resonance imaging analysis.Neuroimaging Clin N Am. 2014 Nov;24(4):695-704. doi: 10.1016/j.nic.2014.07.005. Epub 2014 Sep 10. Neuroimaging Clin N Am. 2014. PMID: 25441508 Review.
-
Modeling the hemodynamic response to brain activation.Neuroimage. 2004;23 Suppl 1:S220-33. doi: 10.1016/j.neuroimage.2004.07.013. Neuroimage. 2004. PMID: 15501093 Review.
Cited by
-
Functional MRI and multivariate autoregressive models.Magn Reson Imaging. 2010 Oct;28(8):1058-65. doi: 10.1016/j.mri.2010.03.002. Epub 2010 May 4. Magn Reson Imaging. 2010. PMID: 20444566 Free PMC article.
-
An introduction to normalization and calibration methods in functional MRI.Psychometrika. 2013 Apr;78(2):308-21. doi: 10.1007/s11336-012-9309-x. Epub 2012 Dec 29. Psychometrika. 2013. PMID: 25107618
-
Functional coordinates: Modeling interactions between brain regions as points in a function space.Netw Neurosci. 2022 Oct 1;6(4):1296-1315. doi: 10.1162/netn_a_00264. eCollection 2022. Netw Neurosci. 2022. PMID: 38800459 Free PMC article.
-
Imaging faster neural dynamics with fast fMRI: A need for updated models of the hemodynamic response.Prog Neurobiol. 2021 Dec;207:102174. doi: 10.1016/j.pneurobio.2021.102174. Epub 2021 Sep 12. Prog Neurobiol. 2021. PMID: 34525404 Free PMC article. Review.
-
Fast fMRI can detect oscillatory neural activity in humans.Proc Natl Acad Sci U S A. 2016 Oct 25;113(43):E6679-E6685. doi: 10.1073/pnas.1608117113. Epub 2016 Oct 11. Proc Natl Acad Sci U S A. 2016. PMID: 27729529 Free PMC article.
References
-
- Bak LK, Schousboe A, Waagepetersen HS. The glutamate/GABA-glutamine cycle: aspects of transport, neurotransmitter homeostasis and ammonia transfer. J Neurochem. 2006;98:641–653. - PubMed
-
- Baseler HA, Sutter EE, Klein SA, Carney T. The topography of visual evoked response properties across the visual field. Electroencephalogr Clin Neurophysiol. 1994;90:65–81. - PubMed
-
- Behzadi Y, Liu TT. An arteriolar compliance model of the cerebral blood flow response to neural stimulus. Neuroimage. 2005;25:1100–1111. - PubMed
-
- Benardete EA, Victor JD. An extension of the m-sequence technique for the analysis of multi-input nonlinear systems. In: Marmarelis VZ, editor. Advanced methods of physiological system modeling. Plenum; New York: 1994. pp. 87–110.
-
- Berwick J, Martin C, Martindale J, Jones M, Johnston D, Zheng Y, Redgrave P, Mayhew J. Hemodynamic response in the unanesthetized rat: intrinsic optical imaging and spectroscopy of the barrel cortex. J Cereb Blood Flow Metab. 2002;22:670–679. - PubMed
Publication types
MeSH terms
Substances
Grants and funding
LinkOut - more resources
Full Text Sources
Medical
