. 2009 Jun 30;106(26):10632-7.
doi: 10.1073/pnas.0901462106. Epub 2009 Jun 11.

Universal behavior of the osmotically compressed cell and its analogy to the colloidal glass transition

Affiliations

Universal behavior of the osmotically compressed cell and its analogy to the colloidal glass transition

E H Zhou et al. Proc Natl Acad Sci U S A. .

Abstract

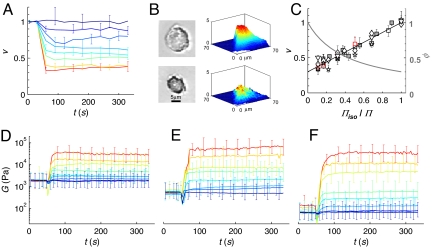
Mechanical robustness of the cell under different modes of stress and deformation is essential to its survival and function. Under tension, mechanical rigidity is provided by the cytoskeletal network; with increasing stress, this network stiffens, providing increased resistance to deformation. However, a cell must also resist compression, which will inevitably occur whenever cell volume is decreased during such biologically important processes as anhydrobiosis and apoptosis. Under compression, individual filaments can buckle, thereby reducing the stiffness and weakening the cytoskeletal network. However, the intracellular space is crowded with macromolecules and organelles that can resist compression. A simple picture describing their behavior is that of colloidal particles; colloids exhibit a sharp increase in viscosity with increasing volume fraction, ultimately undergoing a glass transition and becoming a solid. We investigate the consequences of these 2 competing effects and show that as a cell is compressed by hyperosmotic stress it becomes progressively more rigid. Although this stiffening behavior depends somewhat on cell type, starting conditions, molecular motors, and cytoskeletal contributions, its dependence on solid volume fraction is exponential in every instance. This universal behavior suggests that compression-induced weakening of the network is overwhelmed by crowding-induced stiffening of the cytoplasm. We also show that compression dramatically slows intracellular relaxation processes. The increase in stiffness, combined with the slowing of relaxation processes, is reminiscent of a glass transition of colloidal suspensions, but only when comprised of deformable particles. Our work provides a means to probe the physical nature of the cytoplasm under compression, and leads to results that are universal across cell type.


Conflict of interest statement

The authors declare no conflict of interest.

Figures

Fig. 1.
Fig. 1.
Hyperosmotic stress decreased the volume and increased the stiffness of HASM cells. (A) With the application of hyperosmotic stress at 50 s, cell volume decreased promptly in an osmolality-dependent manner, as measured using optical imaging (Methods). n = 27 to 73 cells for each dose. The color coding for PEG concentration in A, D, E, and F is 0 (darkest blue), 40 (dark blue), 119 (blue), 236 (light blue), 350 (lightest blue), 463 (green), 677 (yellow), 891 (orange), or 1289 (red) mMolal. (B) Effect of osmotic stress on cell geometry measured using optical imaging (Left) or AFM (Right) (Methods). Images of the same cells were shown before (Upper) and after (Lower) applying hyperosmotic stress (1289 mMolal PEG in this example). (C) The dependence of relative cell volume on inverse osmotic stress measured using AFM (inverted triangles) or optical imaging (filled squares, open squares, diamonds, stars, and red squares), for different cell types (inverted triangles, open squares, red squares, HASM cells; diamonds, lung fibroblasts; stars, neuroblastoma cells), 2 osmotic agents (filled squares, sucrose; inverted triangles, open squares, diamonds, stars, and red squares, PEG), and actin-depolymerized HASM cells (red squares). n = 20 cells for the case measured using AFM; n = 145–390 cells for each case tested using optical imaging. In each case, approximately same number of cells was tested for each osmotic stress. (D–F) With the application of hyperosmotic stress at 50 s, cell stiffness, monitored with OMTC (Methods), increased promptly in an osmolality-dependent manner. Cells with no treatment (D), ATP depletion (E), or actin depolymerization (F), are subjected hyperosmotic medium containing PEG. n = 2,081–7,663 beads (≈1 bead per cell) for each treatment. In this and all other figures, a data point with an error bar represents the median value and the interquartile range.
Fig. 2.
Fig. 2.
Dependence of cell stiffness on volume fraction. (A and C) The relation between stiffness and φ for (A) HASM cells subjected to no treatment (black), ATP depletion (green) or actin depolymerization using latrunculin A (red), and for (C) different cell types with no treatment. In all panels, symbol shape denotes cell type: square, diamond, triangle and star correspond to HASM cells, lung fibroblasts, MDCK cells, and neurons, respectively; different colors stand for different treatments: no treatment (black), ATP depletion (green), cytochalasin D (cyan), and latrunculin A (red). Solid symbols (including filled squares) represent RGD beads; open symbols are PLL beads. PEG was used in all cases, except where sucrose was applied to HASM cells w/o any drug treatment (filled squares). For each case, the sample size is at least 2,000 beads, approximately equally distributed among all doses of osmotic stress. (B and D) The relative increase in stiffness with respect to the isotonic baseline (Giso) as a function of volume fraction for (B) HASM cells with various treatments and for (D) different cell types with no treatment. Solid lines represent the relationship G = Giso + GoeFφ in A and C, and GGiso = GoeFφ in B and D. (E) The stiffness at maximum osmotic stress is plotted versus isotonic stiffness for all cases, including different cell types, drug treatments, bead coating and osmotic agents. (F) The exponent F is plotted versus isotonic cell stiffness. Data points with error bars represent median values and interquartile ranges.
Fig. 3.
Fig. 3.
Hyperosmotic stress suppresses cytoskeleton remodeling in a dose dependent manner. (A) MSD of beads tightly bound to cell surface (Methods) as a function of time lag for different concentrations of PEG [0 (dark blue), 119 (blue), 236 (light blue), 350 (lightest blue), 463 (green), 891 (orange), and 1289 (red) mMolal] applied to cells originally in isotonic medium. (Right Insets) Example trajectories of ≈20 beads over 400 s are shown for each osmotic stress, color code being the same as the main graph. Background measurement noise was quantified using beads fixed on collagen-coated plastic surface by drying (black dash line in the main graph and the black trajectories in Right Inset). (Left Inset) All MSD curves at different osmotic stress can be collapsed by horizontal shifting. The amount of shift for each curve, τ, is determined by the Δt at which MSD(Δt) crosses 100 nm2 (the dotted line in the main graph). n = 136–201 beads for each dose. (B) The dependence of the time scale of remodeling on φ is shown for HASM cells treated with ATP depletion (green), latrunculin A (red), or no treatment (black). We quantify the time scale using τ, as defined above in A. For each case, the sample size is at least 326 beads, approximately equally distributed among all doses of osmotic stress. Data points with error bars represent median values and interquartile ranges.
Fig. 4.
Fig. 4.
Cells behave as strong colloidal glass formers. (A) Using the Cox–Merz rule, we estimated the viscosity of the colloidal phase of cells (data symbols are the same as used in Fig. 2). The exponential growth of viscosity for cells is sharply contrasted by the stronger increase in viscosity for hard spheres (16), which greatly accelerates as the volume fraction increased toward the glass transition (pluses). In the x axis, we normalized the volume fraction by that at the glass transition, defined as the point at which viscosity reaches an arbitrarily chosen high value, 40,000 Pa·s. Data for the hard spheres are fitted with Mooney's equation for hard-sphere viscosity (the black curve), and the red line is the Arrhenius equation with 1/T replaced by φ. (B) We quantified the fragility as m = dlog10(η)/d(φ/φg)|φ = φg, and plotted it against the isotonic stiffness. This stiffness for hard spheres was estimated using the Coz-Merz rule at the volume fraction of 0.3. The fragility of the hard spheres is >1 order of magnitude higher, whereas their “isotonic stiffness” is a few orders of magnitude lower, than the corresponding values for cells. Data points with error bars represent median values and interquartile ranges.

References

    1. Elson EL. Cellular mechanics as an indicator of cytoskeletal structure and function. Ann Rev Biophys Chem. 1988;17:397–430. - PubMed
    1. Wang N, Butler JP, Ingber DE. Mechanotransduction across the cell surface and through the cytoskeleton. Science. 1993;260:1124–1127. - PubMed
    1. Fabry B, et al. Scaling the microrheology of living cells. Phys Rev Lett. 2001;87:148102. - PubMed
    1. Bursac P, et al. Cytoskeletal remodelling and slow dynamics in the living cell. Nat Mater. 2005;4:557–571. - PubMed
    1. Trepat X, et al. Universal physical responses to stretch in the living cell. Nature. 2007;447:592–595. - PMC - PubMed

Publication types

MeSH terms