. 2009 Sep;76(3):503-15.
doi: 10.1124/mol.109.056002. Epub 2009 Jun 11.

Hepatic CYP3A suppression by high concentrations of proteasomal inhibitors: a consequence of endoplasmic reticulum (ER) stress induction, activation of RNA-dependent protein kinase-like ER-bound eukaryotic initiation factor 2alpha (eIF2alpha)-kinase (PERK) and general control nonderepressible-2 eIF2alpha kinase (GCN2), and global translational shutoff

Affiliations

Hepatic CYP3A suppression by high concentrations of proteasomal inhibitors: a consequence of endoplasmic reticulum (ER) stress induction, activation of RNA-dependent protein kinase-like ER-bound eukaryotic initiation factor 2alpha (eIF2alpha)-kinase (PERK) and general control nonderepressible-2 eIF2alpha kinase (GCN2), and global translational shutoff

Poulomi Acharya et al. Mol Pharmacol. 2009 Sep.

Abstract

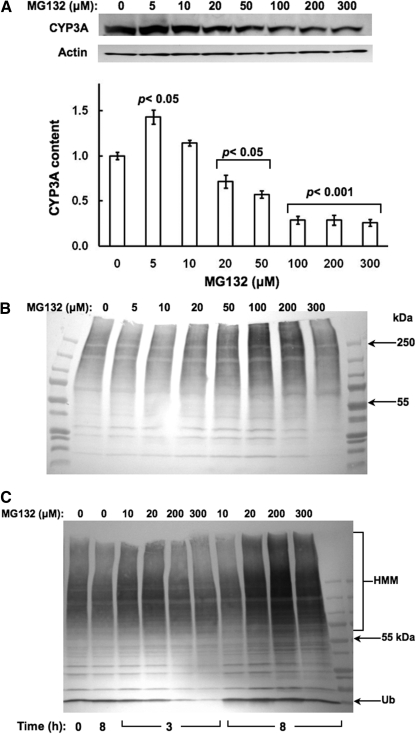
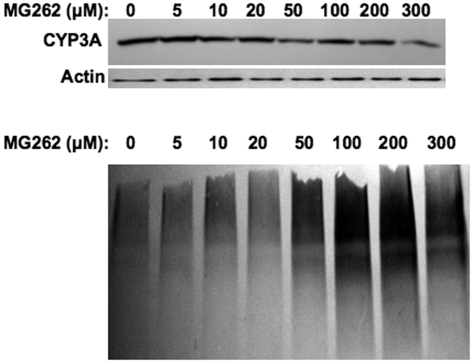
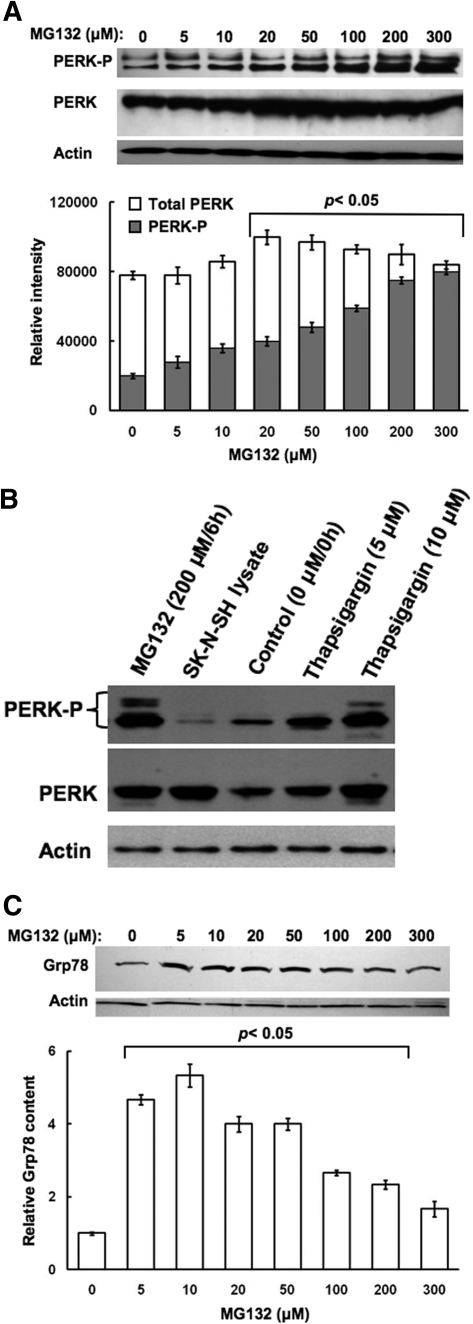
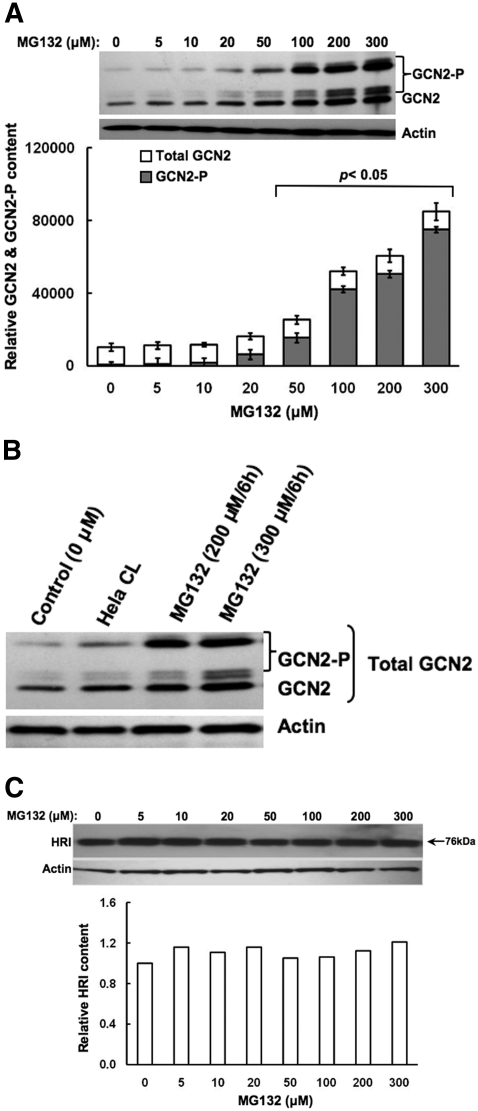
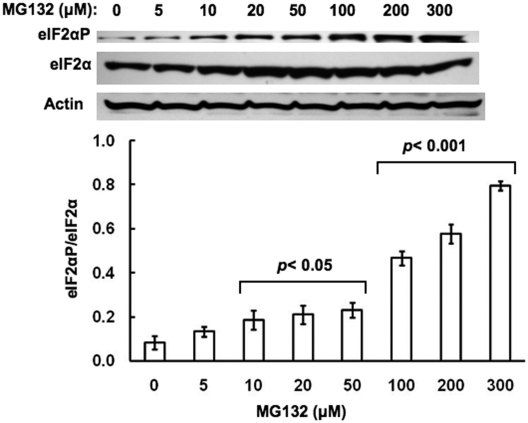
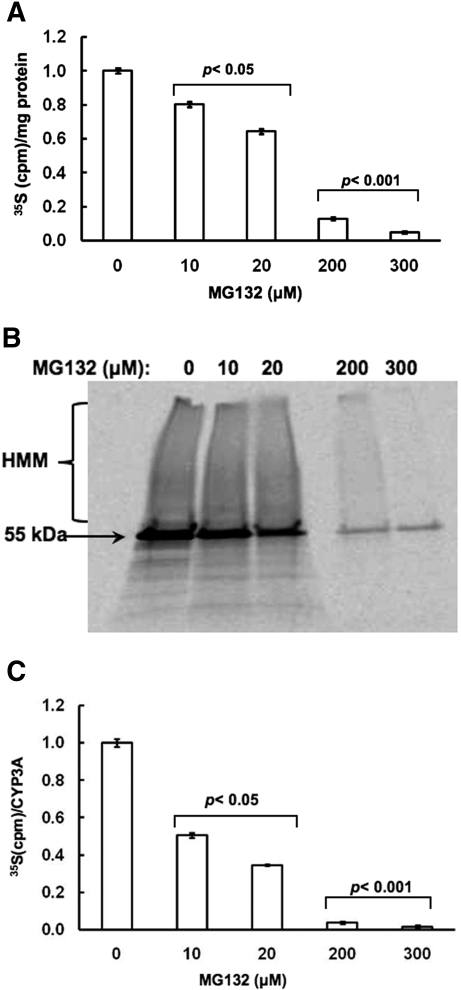
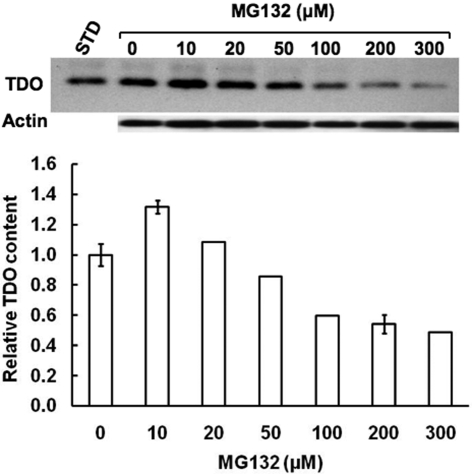
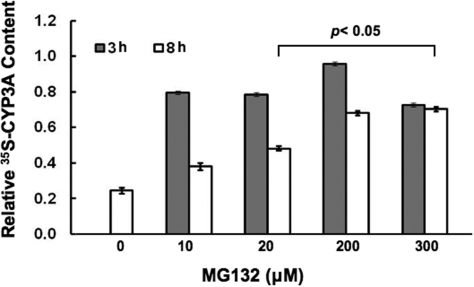
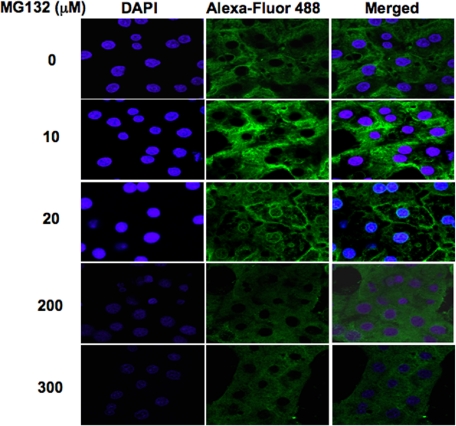
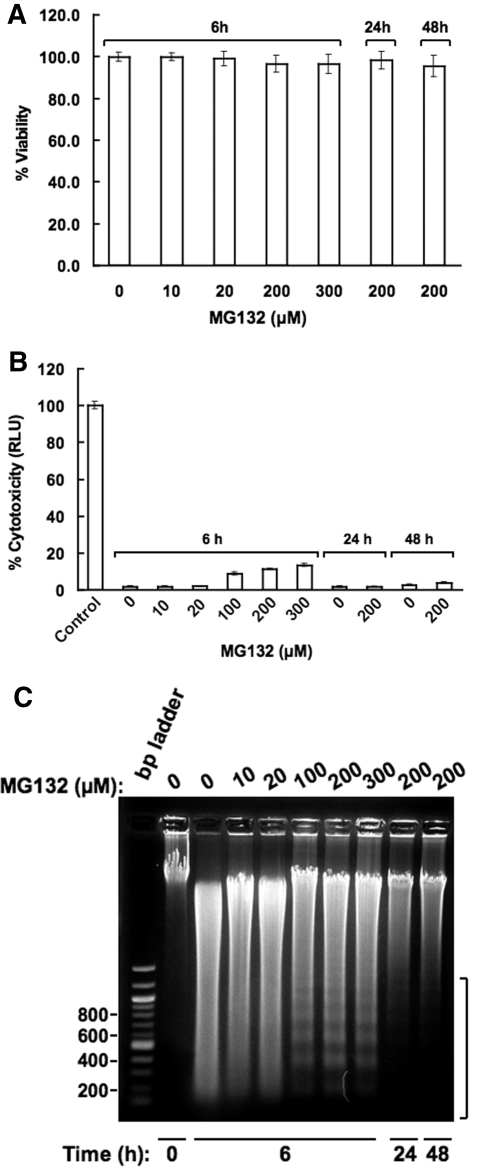
Hepatic cytochromes P450 3A (P450s 3A) are endoplasmic reticulum (ER)-proteins, responsible for xenobiotic metabolism. They are degraded by the ubiquitin-dependent 26S proteasome. Consistent with this, we have shown that proteasomal inhibitors N-benzoyloxycarbonyl (Z)-Leu-Leu-leucinal (MG132) and N-benzoyloxycarbonyl-Leu-Leu-Leu-B(OH)(2) (MG262) stabilize CYP3A proteins. However, MG132 has been reported to suppress P450s 3A as a result of impaired nuclear factor-kappaB activation and consequently reduced CYP3A protein stability. Because the MG132 concentration used in those studies was 10-fold higher than that required for CYP3A stabilization, we examined the effect of MG132 (0-300 microM) concentration-dependent proteasomal inhibition on CYP3A turnover in cultured primary rat hepatocytes. We found a biphasic MG132 concentration effect on CYP3A turnover: Stabilization at 5 to 10 muM with marked suppression at >100 microM. Proteasomal inhibitors reportedly induce ER stress, heat shock, and apoptotic response. At these high MG132 concentrations, such CYP3A suppression could be due to ER stress induction, so we monitored the activity of PERK [PKR (RNA-dependent protein kinase)-like ER kinase (EIF2AK3)], the ER stress-activated eukaryotic initiation factor 2alpha (eIF2alpha) kinase. Indeed, we found a marked (approximately 4-fold) MG132 concentration-dependent PERK autophosphorylation, along with an 8-fold increase in eIF2alpha-phosphorylation. In parallel, MG132 also activated GCN2 [general control nonderepressible-2 (EIF2AK4)] eIF2alpha kinase in a concentration-dependent manner, but not the heme-regulated inhibitor eIF2alpha kinase [(EIF2AK1)]. Pulse-chase, immunoprecipitation/immunoblotting analyses documented the consequently dramatic translational shutoff of total hepatic protein, including but not limited to CYP3A and tryptophan 2,3-dioxygenase protein syntheses. These findings reveal that at high concentrations, MG132 is indeed cytotoxic and can suppress CYP3A synthesis, a result confirmed by confocal immunofluorescence analyses of MG132-treated hepatocytes.


Figures

Fig. 1.
Fig. 1.
Concentration-dependent effects of MG132 on CYP3A content in cultured rat hepatocytes. A, rat hepatocyte cultures were treated with 0 to 300 μM MG132 as detailed. A representative example of Western immunoblotting analyses of rat hepatocyte lysate (RHL; 15 μg of protein) from three separate experiments is shown at the top, and the densitometric quantitation of each experiment normalized to the CYP3A content in the corresponding untreated (0 μM MG132) RHL is shown at the bottom. Corresponding RHL aliquots were used for actin immunoblotting analyses as loading controls. Values represent mean ± S.D. of at the least three separate experiments. Statistically significant differences from the untreated value were observed at p < 0.05 for the 5 μM, p < 0.05 for the 20 and 50 μM, and p < 0.001 for the 100 to 300 μM MG132 treatments. B, aliquots of each of these RHLs were used for CYP3A immunoprecipitation, and subsequent Western immunoblotting analyses of the CYP3A immunoprecipitates with an anti-Ub antibody as detailed under Materials and Methods. C, relative ubiquitination of total RHL protein at 0, 3, and 8 h, confirming proteasomal inhibition by MG132.
Fig. 2.
Fig. 2.
Concentration-dependent effects of MG262 on CYP3A content in cultured human hepatocytes. Human hepatocyte cultures were treated with 0 to 300 μM MG262 as detailed. A representative example of Western immunoblotting analyses of human hepatocyte lysate (15 μg of protein) is shown at the top, with corresponding aliquots used for actin immunoblotting analyses as loading controls. Aliquots of the lysate (1 mg of protein) were used for CYP3A immunoprecipitation, and subsequent Western immunoblotting analyses of the CYP3A immunoprecipitates were made with an anti-Ub antibody as detailed under Materials and Methods. Densitometric quantitation of CYP3A content in hepatocytes treated at various MG262 concentrations relative to basal (1.0) value at 0 μM was as follows: 1.20 (5 μM), 0.92 (10 μM), 0.93 (20 μM), 0.67 (50 μM), 0.77 (100 μM), 0.75 (200 μM), and 0.52 (300 μM).
Fig. 3.
Fig. 3.
Concentration-dependent effects of MG132 on induction of PERK content and its autophosphorylation in cultured rat hepatocytes. A, rat hepatocyte cultures were treated with 0 to 300 μM MG132 as detailed. A representative example of Western immunoblotting analyses of RHL from three separate experiments is shown at the top with corresponding aliquots used for actin immunoblotting analyses as loading controls. The densitometric quantitation of the relative PERK-P content (solid bars) to the total PERK immunochemically detectable content (open bars) in each experiment is shown at the bottom. Values represent mean ± S.D. of at the least three separate experiments. Statistically significant differences in PERK-P content and the PERK-P/PERK values were observed at p < 0.05 for the 20 to 300 μM MG132 treatments. B, the specificity of the anti-PERK and anti-PERK-P antibodies was verified by immunoblotting analyses against lysates from SK-N-SH human neuroblastoma cells overexpressing PERK (400 ng of PERK protein) and lysates (50 μg) from hepatocytes treated with thapsigargin (5 or 10 μM), a well-known ER stress inducer, as positive controls in immunoblotting analyses of lysates (100 μg of protein) from hepatocytes treated with 0 or 200 μM MG132 as detailed above (A). In parallel, smaller aliquots (10 μg protein) of these same SDS-PAGE sample buffer-solubilized cell lysates were subjected to actin immunoblotting analyses. C, RHL aliquots (50 μg of protein) were also used for monitoring Grp78/BiP immunochemically detectable content. A representative example of Grp78 Western immunoblotting analyses of RHL from three separate experiments is shown at the top, with corresponding aliquots used for actin immunoblotting analyses as loading controls. The densitometric quantitation of the immunochemically detectable Grp78 content in each experiment is shown at the bottom. Values represent mean ± S.D. of at the least three separate experiments. Statistically significant increases over the basal (untreated) content were observed at p < 0.05 for 5 to 200 μM MG132 treatments.
Fig. 4.
Fig. 4.
Concentration-dependent effects of MG132 on induction of GCN2 content and HRI content and/or their autophosphorylation in cultured rat hepatocytes. A, rat hepatocyte cultures were treated with 0 to 300 μM MG132 as detailed. A representative example of Western immunoblotting analyses of RHL from three separate experiments (the same SDS-PAGE buffer solubilized RHL used for PERK immunoblotting analyses in Fig. 3A) is shown at the top along with corresponding aliquots used for actin immunoblotting analyses as loading controls. The densitometric quantitation of the relative GCN2-P content (solid bars; hyperphosphorylated forms ranging from 150 to 206 kDa) to the total immunochemically detectable GCN2 content (open bars) in each experiment is shown at the bottom. Values represent mean ± S.D. of at the least three separate experiments. Statistically significant differences in GCN2-P content and the GCN2-P/GCN2 values were observed at p < 0.05 for the 20 to 300 μM and 50 to 300 μM MG132 treatments, respectively. B, the specificity of the anti-GCN2 antibodies was verified against lysates (250 ng of GCN2 protein) from HeLa cells (CL) overexpressing GCN2, in immunoblotting analyses of lysates (50 μg of protein) from hepatocytes treated with 0, 200, or 300 μM MG132 as detailed in A. C, rat hepatocyte cultures were treated with 0 to 300 μM MG132 as detailed. A representative example of Western immunoblotting analyses of RHL (50 μg of protein) from two separate experiments is shown at the top with corresponding aliquots used for actin immunoblotting analyses as loading controls. The densitometric quantitation of the HRI content (band ≈ 76 kDa) is shown at the bottom, as an average value obtained from two separate experiments. Phosphorylated HRI is usually observed at 92 kDa. No bands above 76 kDa were observed in these immunoblots.
Fig. 5.
Fig. 5.
Concentration-dependent effects of MG132 on eIF2αP content relative to the total hepatic eIF2α content in cultured rat hepatocytes. Rat hepatocyte cultures were treated with 0 to 300 μM MG132 as detailed. A representative example of Western immunoblotting analyses of RHL (10 μg of protein) from three separate experiments is shown at the top, with actin used as a protein loading control. The densitometric quantitation of the relative eIF2αP/total eIF2α content in each experiment is shown at the bottom. Values represent the mean ± S.D. derived from the same individual experiments depicted in Figs. 1 and 3, 4, 5. Statistically significant differences in the eIF2αP/total eIF2α ratios were observed at p < 0.05 for the 10 to 50 μM and at p < 0.001 for the 100 to 300 μM MG132 treatments.
Fig. 6.
Fig. 6.
Concentration-dependent effects of MG132 on de novo total protein and CYP3A syntheses in cultured rat hepatocytes. A, rat hepatocyte cultures were treated with 0, 10, 20, 200, and 300 μM MG132 as detailed. Pulse-chase analyses to monitor de novo total protein synthesis at each concentration was carried out as detailed under Materials and Methods. Values are depicted as mean ± S.D. from at the least three separate experiments and are expressed relative to the basal rate observed in the corresponding untreated (0 μM MG132) RHL. Statistically significant differences were observed at p < 0.05 for the MG132 (10 and 20 μM)-treated RHL, and at p < 0.001 for the MG132 (200 and 300 μM)-treated RHL. B, aliquots from the corresponding pulse-chased RHL (B) were used for CYP3A immunoprecipitation analyses. A representative PhosphorImager scan of corresponding aliquots subjected to SDS-PAGE is shown. C, quantitation of 35S incorporated into CYP3A immunoprecipitates per hour is shown. Values depicted are mean ± S.D. from at the least three separate experiments and are expressed relative to the basal rate observed in the CYP3A-immunoprecipitate from the corresponding untreated (0 μM MG132) RHL. Statistically significant differences from basal value were observed at p < 0.05 for the CYP3A immunoprecipitate from MG132 (10 and 20 μM)-treated RHL and at p < 0.001 for the CYP3A immunoprecipitate from MG132 (200 and 300 μM)-treated RHL.
Fig. 7.
Fig. 7.
Concentration-dependent effects of MG132 on hepatic TDO content. Aliquots of lysates (20 μg of protein) from hepatocytes treated with 0, 10, 20, 50, 100, 200, and 300 μM MG132 along with a purified recombinant rat liver TDO (1 pg of protein) as a standard (STD) were also subjected to immunoblotting analyses with rabbit polyclonal anti-TDO IgGs as detailed (Liao et al., 2007). Corresponding aliquots were used for actin immunoblotting analyses as loading controls. Values at 0, 10, and 200 μM MG132 concentrations represent mean ± S.D. of three individual RHL.
Fig. 8.
Fig. 8.
Concentration-dependent effects of MG132 on CYP3A protein degradation by pulse-chase analyses in cultured rat hepatocytes. Rat hepatocyte cultures were treated with 0, 10, 20, 200, and 300 μM MG132 for 0, 3, or 8 h after pulse-chase analyses to monitor CYP3A degradation at each concentration as detailed under Materials and Methods. Aliquots from the corresponding pulse-chased RHL were used for CYP3A immunoprecipitation analyses. Aliquots of CYP3A-immunoprecipitates were quantified for 35S-radioactivity remaining at 3 or 8 h after treatment at each MG132 concentration. Values depicted are mean ± S.D. from at the least three separate experiments and are expressed relative to the basal value observed in the CYP3A immunoprecipitate from the corresponding untreated (0 μM MG132) RHL at 0 h. Statistically significant differences from basal 0-h value were observed at p < 0.05 for the CYP3A immunoprecipitates from RHL treated with MG132 (20, 200, and 300 μM) for 8 h.
Fig. 9.
Fig. 9.
Confocal immunofluorescence CYP3A protein analyses of cultured rat hepatocytes treated with MG132. Rat hepatocyte cultures were treated with 0, 10, 20, 200, and 300 μM MG132 for 8 h. After cross-linking, treated and untreated rat hepatocyte cultures were fixed and simultaneously stained with antibodies to CYP3A (green) and DAPI stain for nuclei (blue). Data including the superimposed images from a representative experiment show CYP3A accumulation at 10 μM and perinuclear/plasma membrane relocalization at 20 μM. A low-grade diffuse green signal throughout the cell body reveals marked loss of CYP3A protein at 200 and 300 μM concentrations. Higher magnification of these panels is shown in Supplemental Figure S3.
Fig. 10.
Fig. 10.
MG132 effects on cell viability, extracellular AK release and hepatic DNA fragmentation in cultured hepatocytes. A, hepatocytes were treated with MG132 for 6 h as detailed and their viability was assessed by the Trypan Blue exclusion assay as described under Materials and Methods. Untreated and MG132 (200 μM)-treated hepatocytes were also examined after 24 and 48 h from the initiation of the treatment but after MG132 withdrawal at 6 h. Data shown are the mean ± S.D. of triplicate samples. There was no statistically significant difference in cell viability between the untreated and MG132-treated cells. B, corresponding AK release into the culture medium was assayed by the ToxiLight Assay kit as described under Materials and Methods. Values represent mean ± S.D. of three separate cell cultures each treated with the indicated MG132 concentration. C, total nuclear DNA was extracted and subjected to agarose gel chromatography in the presence of ethidium bromide as described previously under Materials and Methods. A DNA ladder was included in parallel as a standard. A representative of one experiment conducted after MG132 (0-300 μM) treatment of hepatocytes for 6 h is shown. Similar analyses of DNA extracted from cells harvested at 24 and 48 h after initial 6 h treatment with MG132 (200 μM) are also shown.

References

    1. Berlanga JJ, Santoyo J, and De Haro C (1999) Characterization of a mammalian homolog of the GCN2 eukaryotic initiation factor 2alpha kinase. Eur J Biochem 265 754-762. - PubMed
    1. Bush KT, Goldberg AL, and Nigam SK (1997) Proteasome inhibition leads to a heat-shock response, induction of endoplasmic reticulum chaperones, and thermotolerance. J Biol Chem 272 9086-9092. - PubMed
    1. Correia MA, Sadeghi S, and Mundo-Paredes E (2005) Cytochrome P450 ubiquitination: branding for the proteolytic slaughter? Annu Rev Pharmacol Toxicol 45 439-464. - PubMed
    1. Faouzi S, Medzihradszky KF, Hefner C, Maher JJ, and Correia MA (2007) Characterization of the physiological turnover of native and inactivated cytochromes P450 3A in cultured rat hepatocytes: a role for the cytosolic AAA ATPase p97? Biochemistry 46 7793-7803. - PMC - PubMed
    1. Fribley A, Zeng Q, and Wang CY (2004) Proteasome inhibitor PS-341 induces apoptosis through induction of endoplasmic reticulum stress-reactive oxygen species in head and neck squamous cell carcinoma cells. Mol Cell Biol 24 9695-9704. - PMC - PubMed

Publication types

MeSH terms

LinkOut - more resources