Imaging and quantitative analysis of atherosclerotic lesions by CARS-based multimodal nonlinear optical microscopy
- PMID: 19520975
- PMCID: PMC2741426
- DOI: 10.1161/ATVBAHA.109.189316
Imaging and quantitative analysis of atherosclerotic lesions by CARS-based multimodal nonlinear optical microscopy
Abstract
Objective: The purpose of this study was to assess the ability of label-free multimodal nonlinear optical (NLO) microscopy to characterize, and thus enable quantitative in situ analyses of, different atherosclerotic lesion types, according to the original scheme suggested by the AHA Committee.
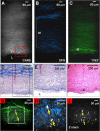
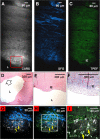
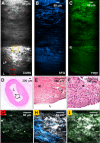
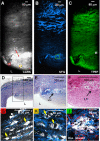
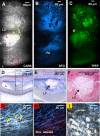
Methods and results: Iliac arteries were taken from 24 male Ossabaw pigs divided into lean control and metabolic syndrome groups and were imaged by multimodal NLO microscopy where sum-frequency generation (SFG) and 2-photon excitation fluorescence (TPEF) were integrated on a coherent anti-Stokes Raman scattering (CARS) microscope platform. Foam cells, lipid deposits, matrices, and fibrous caps were visualized with submicron 3D resolution. Starting from the adaptive intimal thickening in the initial stage to the fibrous atheroma or mineralization in the advanced stages, lesions were visualized without labels. Histological staining of each lesion confirmed the lesion stages. Lipid and collagen contents were quantitatively analyzed based on the CARS and SFG signals. Lipid accumulation in thickened intima culminated in type IV whereas the highest collagen deposition was found in Type V lesions. Luminal CARS imaging showed the capability of viewing the location of superficial foam cells that indicate relatively active locus in a lesion artery.
Conclusions: We have demonstrated the capability of CARS-based multimodal NLO microscopy to interrogate different stages of lesion development with subcellular detail to permit quantitative analysis of lipid and collagen contents.
Figures
Similar articles
-
Label-free molecular imaging of atherosclerotic lesions using multimodal nonlinear optical microscopy.J Biomed Opt. 2007 Sep-Oct;12(5):054007. doi: 10.1117/1.2795437. J Biomed Opt. 2007. PMID: 17994895 Free PMC article.
-
Multimodal CARS microscopy determination of the impact of diet on macrophage infiltration and lipid accumulation on plaque formation in ApoE-deficient mice.J Lipid Res. 2010 Jul;51(7):1729-37. doi: 10.1194/jlr.M003616. Epub 2010 Mar 5. J Lipid Res. 2010. PMID: 20208058 Free PMC article.
-
Multiplex coherent anti-stokes Raman spectroscopy images intact atheromatous lesions and concomitantly identifies distinct chemical profiles of atherosclerotic lipids.Circ Res. 2010 Apr 30;106(8):1332-41. doi: 10.1161/CIRCRESAHA.109.208678. Epub 2010 Mar 18. Circ Res. 2010. PMID: 20299664
-
(Second) Harmonic Disharmony: Nonlinear Microscopy Shines New Light on the Pathology of Atherosclerosis.Microsc Microanal. 2016 Jun;22(3):589-98. doi: 10.1017/S1431927616000842. Microsc Microanal. 2016. PMID: 27329310 Review.
-
A definition of advanced types of atherosclerotic lesions and a histological classification of atherosclerosis. A report from the Committee on Vascular Lesions of the Council on Arteriosclerosis, American Heart Association.Circulation. 1995 Sep 1;92(5):1355-74. doi: 10.1161/01.cir.92.5.1355. Circulation. 1995. PMID: 7648691 Review.
Cited by
-
Metabolic syndrome and coronary artery disease in Ossabaw compared with Yucatan swine.Comp Med. 2010 Aug;60(4):300-15. Comp Med. 2010. PMID: 20819380 Free PMC article.
-
Ca2+ regulatory mechanisms of exercise protection against coronary artery disease in metabolic syndrome and diabetes.J Appl Physiol (1985). 2011 Aug;111(2):573-86. doi: 10.1152/japplphysiol.00373.2011. Epub 2011 May 19. J Appl Physiol (1985). 2011. PMID: 21596923 Free PMC article. Review.
-
Marvels, mysteries, and misconceptions of vascular compensation to peripheral artery occlusion.Microcirculation. 2010 Jan;17(1):3-20. doi: 10.1111/j.1549-8719.2010.00008.x. Microcirculation. 2010. PMID: 20141596 Free PMC article. Review.
-
Label-free multiphoton microscopy as a tool to investigate alterations of cerebral aneurysms.Sci Rep. 2020 Jul 23;10(1):12359. doi: 10.1038/s41598-020-69222-5. Sci Rep. 2020. PMID: 32704100 Free PMC article.
-
Biphasic alterations in coronary smooth muscle Ca(2+) regulation in a repeat cross-sectional study of coronary artery disease severity in metabolic syndrome.Atherosclerosis. 2016 Jun;249:1-9. doi: 10.1016/j.atherosclerosis.2016.03.032. Epub 2016 Mar 26. Atherosclerosis. 2016. PMID: 27062403 Free PMC article.
References
-
- AHA Heart Disease and Stroke Statistics - 2008 update. 2008. - PubMed
-
- Yusuf S, Reddy S, Ounpuu S, Anand S. Global burden of cardiovascular diseases part I: general considerations, the epidemiologic transition, risk factors and impact of urbanization. Circulation. 2001;104:2746–2753. - PubMed
-
- Sanz J, Fayad ZA. Imaging of atherosclerotic cardiovascular disease. Nature. 2008;451:953–957. - PubMed
-
- Nahrendorf M, Jaffer FA, Kelly KA, Sosnovik DE, Aikawa E, Libby P, Weissleder R. Noninvasive Vascular Cell Adhesion Molecule-1 Imaging Identifies Inflammatory Activation of Cells in Atherosclerosis. Circulation. 2006;114:1504–1511. - PubMed
-
- Amirbekian V, Lipinski MJ, Briley-Saebo KC, Amirbekian S, Aguinaldo JGS, Weinreb DB, Vucic E, Frias JC, Hyafil F, Mani V, Fisher EA, Fayad ZA. Detecting and assessing macrophages in vivo to evaluate atherosclerosis noninvasively using molecular MRI. Proc Natl Acad Sci USA. 2007;104:961–966. - PMC - PubMed
Publication types
MeSH terms
Substances
Grants and funding
LinkOut - more resources
Full Text Sources
Other Literature Sources
Medical
Miscellaneous

