. 2009;68(3):151-70.
doi: 10.1159/000224636. Epub 2009 Jun 11.

Genome scan, fine-mapping, and candidate gene analysis of non-syndromic cleft lip with or without cleft palate reveals phenotype-specific differences in linkage and association results

Affiliations

Genome scan, fine-mapping, and candidate gene analysis of non-syndromic cleft lip with or without cleft palate reveals phenotype-specific differences in linkage and association results

Mary L Marazita et al. Hum Hered. 2009.

Abstract

Objectives: Non-syndromic orofacial clefts, i.e. cleft lip (CL) and cleft palate (CP), are among the most common birth defects. The goal of this study was to identify genomic regions and genes for CL with or without CP (CL/P).

Methods: We performed linkage analyses of a 10 cM genome scan in 820 multiplex CL/P families (6,565 individuals). Significant linkage results were followed by association analyses of 1,476 SNPs in candidate genes and regions, utilizing a weighted false discovery rate (wFDR) approach to control for multiple testing and incorporate the genome scan results.

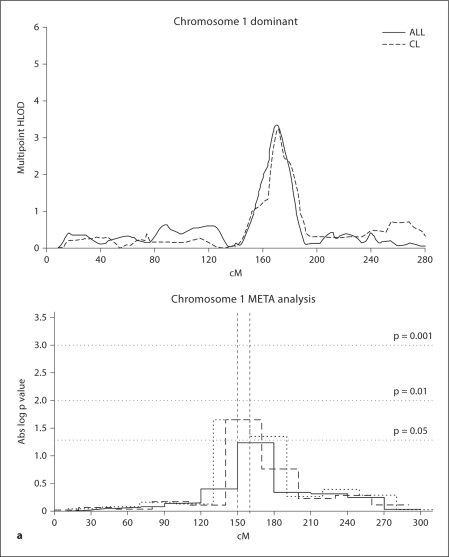
Results: Significant (multipoint HLOD >or=3.2) or genome-wide-significant (HLOD >or=4.02) linkage results were found for regions 1q32, 2p13, 3q27-28, 9q21, 12p11, 14q21-24 and 16q24. SNPs in IRF6 (1q32) and in or near FOXE1 (9q21) reached formal genome-wide wFDR-adjusted significance. Further, results were phenotype dependent in that the IRF6 region results were most significant for families in which affected individuals have CL alone, and the FOXE1 region results were most significant in families in which some or all of the affected individuals have CL with CP.

Conclusions: These results highlight the importance of careful phenotypic delineation in large samples of families for genetic analyses of complex, heterogeneous traits such as CL/P.


Figures

Fig. 1
Fig. 1
Summary of the 10 cM genome scan of CL/P. Each graph depicts the maximum summed multipoint HLOD on each chromosome, under both dominant (black) and recessive (grey) genetic models assumed. A Summary for TOTAL, the entire dataset. B Summary for the CL subset, i.e. those families in which all affecteds have CL alone. C Summary for the CL+CLP subset, i.e. those families in which at least one affected has CL alone and at least one has CL+CP. D Summary for the CLP subset, i.e. those families in which all affected members have CL+CP.
Fig. 2a
Fig. 2a
Summed multipoint HLOD plots for each chromosome that had a maximum summed HLOD ≥3.2 (under the best genetic model for each chromosome), in the entire dataset (TOTAL), and the subsets - see definitions in figure 1. For each of those chromosomes, also shown are the graphs of the Minimum Regions of Maximal Significance (MRMS). These graphs summarize the process of repeating the Genome Scan Meta Analyses (GSMA), shifting the bins in order to narrow the region of potential involvement with CL/P. For those chromosomes with statistically significant GSMA/MRMS results (i.e. p values ≤0.05), dashed vertical lines indicate the 10 cM MRMS. a Chromosome 1 under a dominant model for TOTAL and for the CL subset.
Fig. 2b
Fig. 2b
Summed multipoint HLOD plots for each chromosome that had a maximum summed HLOD ≥3.2 (under the best genetic model for each chromosome), in the entire dataset (TOTAL), and the subsets - see definitions in figure 1. For each of those chromosomes, also shown are the graphs of the Minimum Regions of Maximal Significance (MRMS). These graphs summarize the process of repeating the Genome Scan Meta Analyses (GSMA), shifting the bins in order to narrow the region of potential involvement with CL/P. For those chromosomes with statistically significant GSMA/MRMS results (i.e. p values ≤0.05), dashed vertical lines indicate the 10 cM MRMS. b Chromosome 2 (dominant).
Fig. 2c
Fig. 2c
Summed multipoint HLOD plots for each chromosome that had a maximum summed HLOD ≥3.2 (under the best genetic model for each chromosome), in the entire dataset (TOTAL), and the subsets - see definitions in figure 1. For each of those chromosomes, also shown are the graphs of the Minimum Regions of Maximal Significance (MRMS). These graphs summarize the process of repeating the Genome Scan Meta Analyses (GSMA), shifting the bins in order to narrow the region of potential involvement with CL/P. For those chromosomes with statistically significant GSMA/MRMS results (i.e. p values ≤0.05), dashed vertical lines indicate the 10 cM MRMS. c Chromosome 3 (dominant).
Fig. 2d
Fig. 2d
Summed multipoint HLOD plots for each chromosome that had a maximum summed HLOD ≥3.2 (under the best genetic model for each chromosome), in the entire dataset (TOTAL), and the subsets - see definitions in figure 1. For each of those chromosomes, also shown are the graphs of the Minimum Regions of Maximal Significance (MRMS). These graphs summarize the process of repeating the Genome Scan Meta Analyses (GSMA), shifting the bins in order to narrow the region of potential involvement with CL/P. For those chromosomes with statistically significant GSMA/MRMS results (i.e. p values ≤0.05), dashed vertical lines indicate the 10 cM MRMS. d Chromosome 9 (dominant, TOTAL and CL+ CLP).
Fig. 2e
Fig. 2e
Summed multipoint HLOD plots for each chromosome that had a maximum summed HLOD ≥3.2 (under the best genetic model for each chromosome), in the entire dataset (TOTAL), and the subsets - see definitions in figure 1. For each of those chromosomes, also shown are the graphs of the Minimum Regions of Maximal Significance (MRMS). These graphs summarize the process of repeating the Genome Scan Meta Analyses (GSMA), shifting the bins in order to narrow the region of potential involvement with CL/P. For those chromosomes with statistically significant GSMA/MRMS results (i.e. p values ≤0.05), dashed vertical lines indicate the 10 cM MRMS. e Chromosome 12 (dominant, TOTAL and CLP subgroup).
Fig. 2f
Fig. 2f
Summed multipoint HLOD plots for each chromosome that had a maximum summed HLOD ≥3.2 (under the best genetic model for each chromosome), in the entire dataset (TOTAL), and the subsets - see definitions in figure 1. For each of those chromosomes, also shown are the graphs of the Minimum Regions of Maximal Significance (MRMS). These graphs summarize the process of repeating the Genome Scan Meta Analyses (GSMA), shifting the bins in order to narrow the region of potential involvement with CL/P. For those chromosomes with statistically significant GSMA/MRMS results (i.e. p values ≤0.05), dashed vertical lines indicate the 10 cM MRMS. f Chromosome 14 (recessive).
Fig. 2g
Fig. 2g
Summed multipoint HLOD plots for each chromosome that had a maximum summed HLOD ≥3.2 (under the best genetic model for each chromosome), in the entire dataset (TOTAL), and the subsets - see definitions in figure 1. For each of those chromosomes, also shown are the graphs of the Minimum Regions of Maximal Significance (MRMS). These graphs summarize the process of repeating the Genome Scan Meta Analyses (GSMA), shifting the bins in order to narrow the region of potential involvement with CL/P. For those chromosomes with statistically significant GSMA/MRMS results (i.e. p values ≤0.05), dashed vertical lines indicate the 10 cM MRMS. g Chromosome 16 (recessive in TOTAL and CL+ CLP).
Fig. 3
Fig. 3
Summaries of the weighted False Discovery Rate (wFDR) results for 1,476 SNPs selected within candidate genes or to fine-map the linkage peaks. Shown are graphs for the TOTAL dataset, and the CLP and CL+CLP subsets, i.e. those subsets in which there were genome-significant wFDR results. Shown are the −log10 (wFDR p values), with the SNPs arrayed across the genome from chromosome 1 (leftsideof X axis) to chromosome 22.
Fig. 4
Fig. 4
Depicted are the LD patterns estimated in the HapMap CEU population for multiple SNPs in FOXE1. The SNPs marked with asterisks (*) are those that were found to be genome-wide significantly associated with CL/P in the current study (TOTAL and CL+CLP subset). The other SNPs have recently been found by our group to be strongly associated with CL/P (Moreno et al., unpublished results).

References

    1. Murray JC, Schutte BC. Cleft palate: Players, pathways, and pursuits. J Clin Invest. 2004;113:1676–1678. - PMC - PubMed
    1. Trew CJ. Sistens plura exempla palati deficientis. Nova Acta Physio-Medica Academiae Caesareae Leopoldion-Carolinae. 1757;1:445–447.
    1. Darwin C. The Variation of Plants and Animals under Domestication. New York: Appleton; 1875.
    1. Sproule J. Hereditary nature of hare-lip. Br Med J. 1863;1:412.
    1. Rischbieth H. Hare-lip and cleft palate. In: Pearson K, editor. Treasure of Human Inheritance, part iv. London: Dulau; 1910. pp. 79–123.

Publication types