. 2009 Jun;5(6):e1000515.
doi: 10.1371/journal.pgen.1000515. Epub 2009 Jun 12.

A genome-wide screen for regulators of TORC1 in response to amino acid starvation reveals a conserved Npr2/3 complex

Affiliations

A genome-wide screen for regulators of TORC1 in response to amino acid starvation reveals a conserved Npr2/3 complex

Taavi K Neklesa et al. PLoS Genet. 2009 Jun.

Abstract

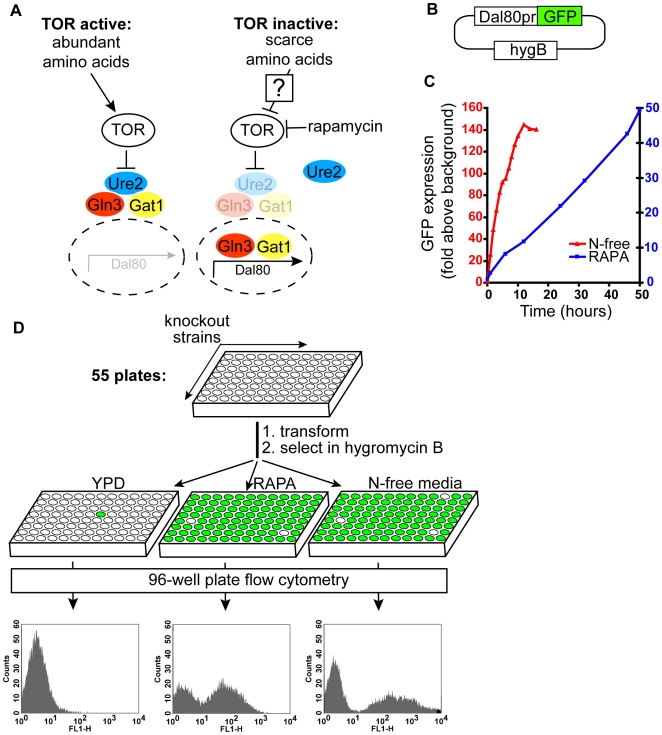
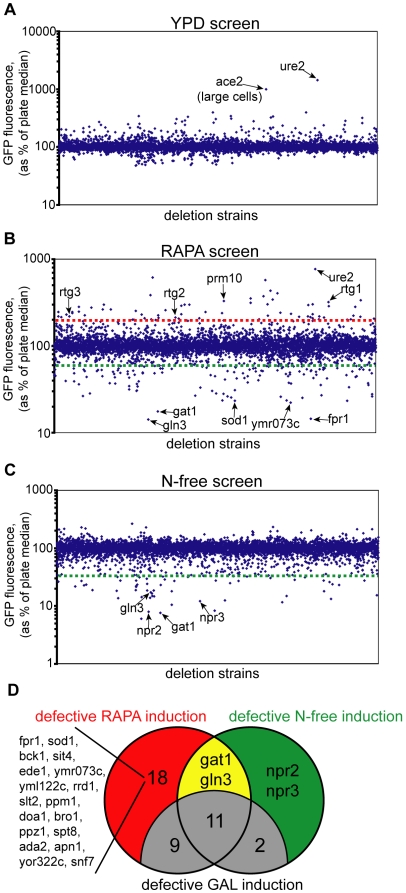
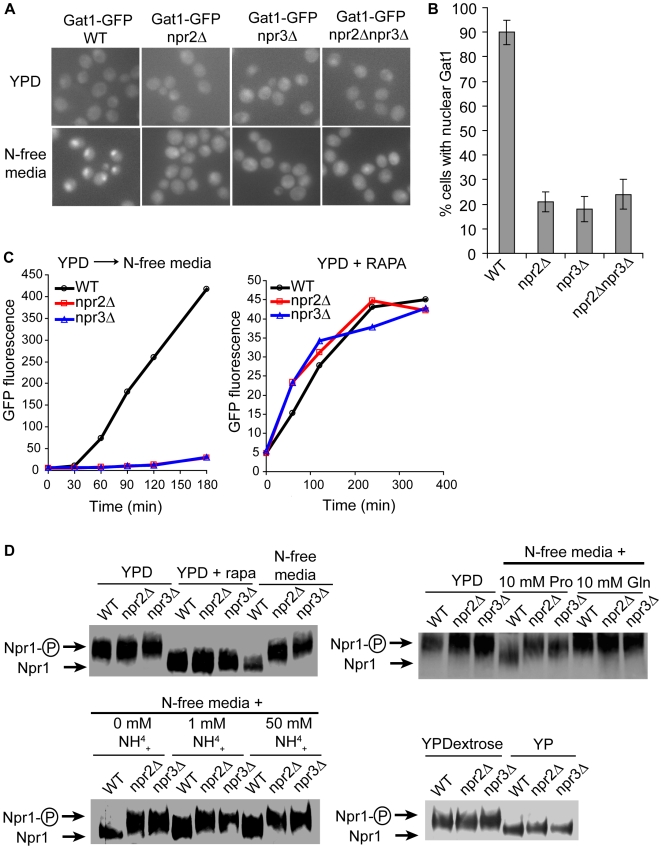
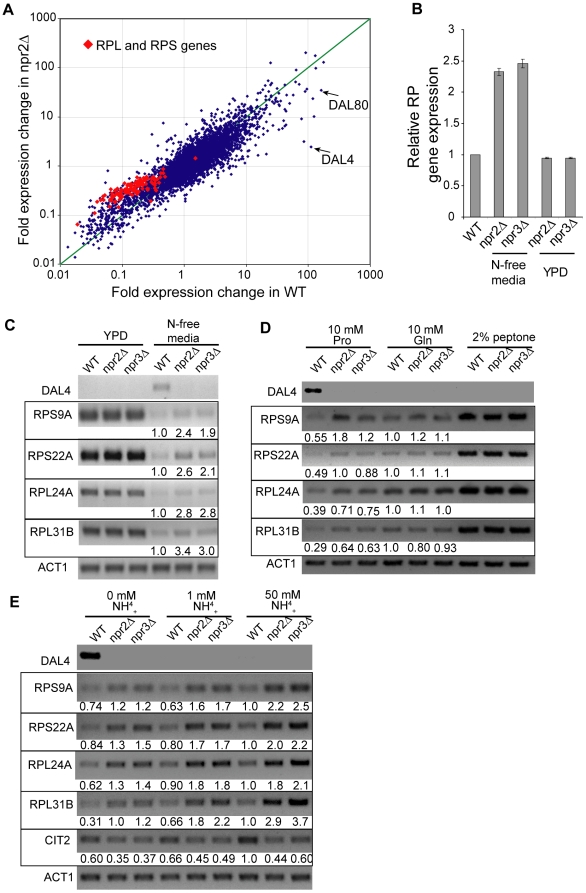
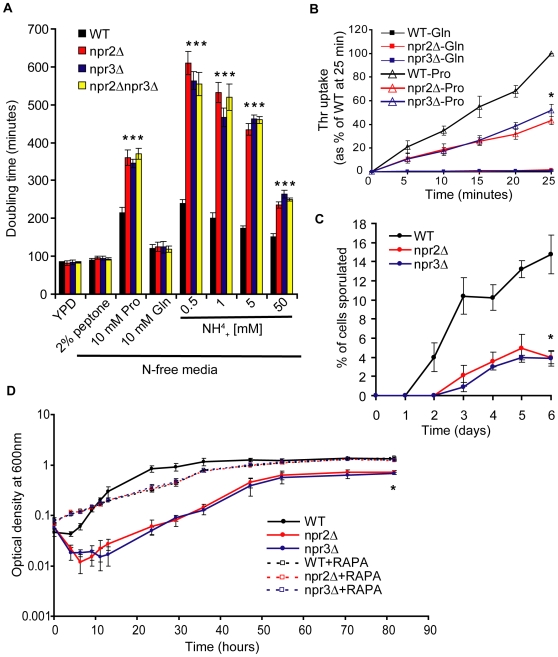
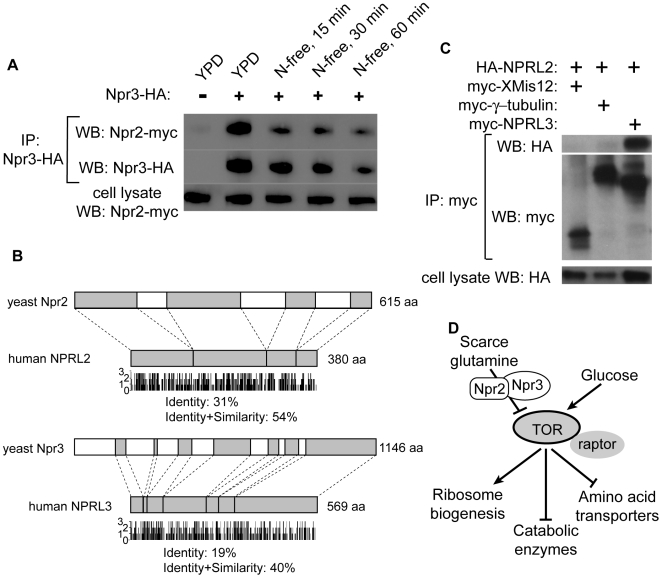
TORC1 is a central regulator of cell growth in response to amino acid availability, yet little is known about how it is regulated. Here, we performed a reverse genetic screen in yeast for genes necessary to inactivate TORC1. The screen consisted of monitoring the expression of a TORC1 sensitive GFP-based transcriptional reporter in all yeast deletion strains using flow cytometry. We find that in response to amino acid starvation, but not to carbon starvation or rapamycin treatment, cells lacking NPR2 and NPR3 fail to fully (1) activate transcription factors Gln3/Gat1, (2) dephosphorylate TORC1 effector Npr1, and (3) repress ribosomal protein gene expression. Both mutants show proliferation defects only in media containing a low quality nitrogen source, such as proline or ammonia, whereas no defects are evident when cells are grown in the presence of glutamine or peptone mixture. Proliferation defects in npr2Delta and npr3Delta cells can be completely rescued by artificially inhibiting TORC1 by rapamycin, demonstrating that overactive TORC1 in both strains prevents their ability to adapt to an environment containing a low quality nitrogen source. A biochemical purification of each demonstrates that Npr2 and Npr3 form a heterodimer, and this interaction is evolutionarily conserved since the human homologs of NPR2 and NPR3 (NPRL2 and NPRL3, respectively) also co-immunoprecipitate. We conclude that, in yeast, the Npr2/3 complex mediates an amino acid starvation signal to TORC1.


Conflict of interest statement

The authors have declared that no competing interests exist.

Figures

Figure 1
Figure 1. A genetic screen for regulators of TORC1.
(A) A schematic of the TORC1 pathway. In nutrient rich environment, TORC1 is active and Gln3/Gat1 are in the cytoplasm. Upon TORC1 inactivation by rapamycin or amino acid starvation, Gln3 and Gat1 translocate into the nucleus, leading to the transcriptional activation of Dal80. (B) Dal80 gene expression reporter contains 600 basepairs of Dal80 promoter driving the expression of GFP. HygB, hygromycin B resistance gene, is used for selection of transformants. (C) Accumulation of GFP in cells is linear. Wildtype cells transformed with Dal80pr-GFP plasmid were treated either with rapamycin (20 ng/mL) or inoculated into nitrogen free medium. At indicated timepoints the average GFP content of the cells was determined by flow cytometry. (D) Fifty-five 96-well plates, containing all non-essential yeast deletion strains, were transformed with the Dal80pr-GFP reporter plasmid. The cells in each plate were grown under 3 conditions: YPD for 6 hours, YPD+rapamycin for 15 hours or N-free media for 4 hours. GFP content was determined by flow cytometry.
Figure 2
Figure 2. An identification of Npr2 and Npr3 as TORC1 regulators.
(A) Average GFP content was determined for each strain after growth in YPD medium. As plates were screened at different days, each strain was compared to the median GFP intensity of its 96-well plate. Cells that over-express Dal80pr-GFP have a GFP reading over 100%, and vice versa. (B) Same as in (A), except Dal80pr-GFP was monitored after 15 hour growth in YPD medium containing 20 ng/mL of rapamycin. Strains above the red line have a GFP content more than twice the plate median, and strains below the green line have GFP content 60% or less than the plate median. (C) Same as in (A), except Dal80pr-GFP was monitored after 4 hour growth in N-free medium, which lacks all sources of nitrogen and amino acids. (D) Venn diagram of strains that fail to induce Dal80pr-GFP in response to rapamycin treatment and N-free exposure. To eliminate strains that are generally inefficient at GFP expression, the expression of Gal1pr-GFP was monitored in all strains that failed to induce Dal80pr-GFP (see text for details).
Figure 3
Figure 3. Npr2 and Npr3 proteins mediate the inactivation of TORC1 by amino acid starvation.
(A) Genomically GFP-tagged Gat1 strains were grown in the YPD medium, and then shifted to N-free medium for 30 minutes. Gat1 localization was observed in the indicated strains by fluorescence microscopy. (B) Quantification of cells with nuclear GFP signal from (A). (C) Monitoring the expression of Dal80pr-GFP in npr2Δ and npr3Δ cells after a shift to N-free media and after rapamycin induction. (D) TORC1 effector Npr1 is dephosphorylated in npr2Δ and npr3Δ cells upon rapamycin treatment and carbon starvation but not upon nitrogen starvation. Genomically HA-tagged Npr1 strains were grown in YPD, treated with 50 ng/mL of rapamycin or transferred to N-free media for 30 minutes (upper left). YPD cultures were shifted to N-free media supplemented with 10 mM proline or 10 mM glutamine (upper right), or they were shifted to N-free media supplemented with indicated concentrations of ammonium sulfate (lower left) for 30 minutes. Cultures were grown on YPD or YP(- dextrose) for 30 minutes (lower right). The phosphorylation state of Npr1 was determined by Western blotting.
Figure 4
Figure 4. npr2Δ and npr3Δ cells fail to repress RP gene expression when grown in a non-preferred nitrogen source.
(A) Gene expression profile of WT and npr2Δ cells shifted from YPD to N-free media. For each gene, a fold change in expression from YPD media to 30 minutes in N-free media is plotted. This ratio for WT cells is plotted in the X-axis and the same ratio for npr2Δ is plotted in the Y-axis. Identical results were obtained with npr3Δ. The expression of large and small ribosomal protein genes, RPL and RPS, respectively, is in shown in red. (B) Relative level of RP gene expression with respect to WT. The expression of each RP mRNA in npr2Δ and npr3Δ cells was compared to the level of its expression in WT cells and the average ratio is shown. Note the higher expression of RP genes in npr2Δ and npr3Δ cells in N-free media and similar expression in YPD media. (C) Quantitative RT-PCR of RPL and RPS mRNA. Total RNA was isolated from WT, npr2Δ and npr3Δ cells grown in either YPD or N-free media and the expression was determined by RT-PCR. Each mRNA was quantitated with respect to WT cells grown in N-free media. (D) Quantitative RT-PCR was performed on cells grown in N-free media supplemented 10 mM proline, 10 mM glutamine or 2% peptone. Each mRNA was quantitated with respect to WT cells grown in 10 mM glutamine media. (E) Quantitative RT-PCR was performed on cells grown in N-free media supplemented with 0, 1 or 50 mM ammonium sulfate. Each mRNA was quantitated with respect to WT cells grown in 50 mM ammonium sulfate.
Figure 5
Figure 5. A phenotypic characterization of npr2Δ and npr3Δ strains.
(A) npr2Δ and npr3Δ cells have a severe proliferation defect in proline or ammonia containing media, but not in glutamine or peptone containing media. The cells were grown in media with indicated concentrations of nitrogen source, and the doubling time was determined from an exponential growth phase. Asterisk denotes a difference of p<0.01 compared to WT (determined by Student t-test). (B) A poor nitrogen source, such as proline, fails to fully activate threonine uptake in npr2Δ and npr3Δ cells. The cells were grown on either 5 mM Pro or 5 mM Gln as a nitrogen source for 4 hours, upon which time radiolabeled Thr uptake was measured. Asterisk denotes a difference of p<0.01 compared to WT (determined by Student t-test). (C) npr2Δ and npr3Δ cells exhibit a delayed and lower sporulation efficiency upon nitrogen starvation. Asterisk denotes a difference of p<0.01 compared to WT (determined by Student t-test). (D) TORC1 inhibition by rapamycin rescues npr2Δ and npr3Δ phenotypes associated with nitrogen limitation. YPD grown prototrophic cells were shifted to N-free media supplemented with 0.5 mM ammonium sulfate with or without 20 ng/mL of rapamycin, and their proliferation was monitored by optical density measurements. Note the cell lysis, delayed proliferation start and lower saturating cell concentrations in npr2Δ and npr3Δ cell cultures, all of which can be rescued by inclusion of rapamycin in the media. Asterisk denotes a difference of p<0.01 compared to WT (determined by Student t-test).
Figure 6
Figure 6. Npr2 and Npr3 are evolutionarily conserved and their orthologues interact in yeast and human cells.
(A) Npr2 and Npr3 form a nutrient insensitive complex in yeast. A genomically tagged Npr2-myc and Npr3-HA strain was immunoprecipitated with anti-HA antibodies, and the immunoprecipitates were analyzed by Western blotting with anti-HA and anti-myc antibodies. (B) Protein sequence alignment between yeast Npr2 and human NPRL2, and between yeast Npr3 and human NPRL3. 3 indicates identity, 2 strong similarity, 1 weak similarity and 0 no similarity. (C) NPRL2 and NPRL3 interact in human cells. HA-NPRL2 was cotransfected into HeLa cells with myc-XMis12, myc-γ-tubulin or myc-NPRL3 for 2 days. Myc-fusion proteins were immunoprecipitated with anti-myc antibodies, and the immunoprecipitates were analyzed by Western blotting with anti-HA- and anti-myc antibodies. (D) A proposed model for Npr2/3. When the cells encounter an environment with limited availability of preferred amino acids (e.g. glutamine), the cells adapt to the new environment by decreasing the TORC1 activity via the action of the Npr2/3 complex. Npr2/3 complex does not appear to play a role in signaling the presence of abundant amounts of amino acids or glucose limitation.

References

    1. Wullschleger S, Loewith R, Hall MN. TOR signaling in growth and metabolism. Cell. 2006;124:471–484. - PubMed
    1. Kim DH, Sarbassov DD, Ali SM, King JE, Latek RR, et al. mTOR interacts with raptor to form a nutrient-sensitive complex that signals to the cell growth machinery. Cell. 2002;110:163–175. - PubMed
    1. Sarbassov DD, Ali SM, Kim DH, Guertin DA, Latek RR, et al. Rictor, a novel binding partner of mTOR, defines a rapamycin-insensitive and raptor-independent pathway that regulates the cytoskeleton. Current biology. 2004;14:1296–1302. - PubMed
    1. Loewith R, Jacinto E, Wullschleger S, Lorberg A, Crespo JL, et al. Two TOR complexes, only one of which is rapamycin sensitive, have distinct roles in cell growth control. Molecular Cell. 2002;10:457–468. - PubMed
    1. Sarbassov DD, Guertin DA, Ali SM, Sabatini DM. Phosphorylation and regulation of Akt/PKB by the rictor-mTOR complex. Science. 2005;307:1098–1101. - PubMed

Publication types

MeSH terms

Substances