. 2009 Jun 1:3:10.
doi: 10.3389/neuro.07.010.2009. eCollection 2009.

Behavioral modulation of stimulus-evoked oscillations in barrel cortex of alert rats

Affiliations

Behavioral modulation of stimulus-evoked oscillations in barrel cortex of alert rats

Subramaniam Venkatraman et al. Front Integr Neurosci. .

Abstract

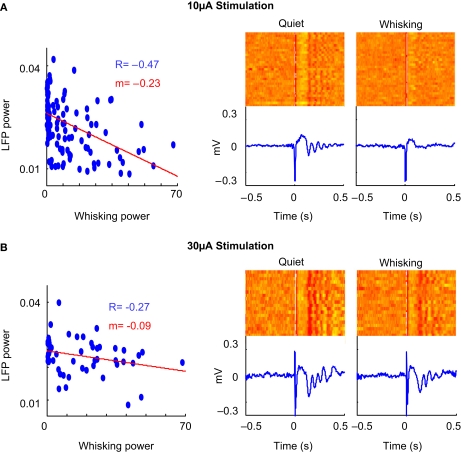
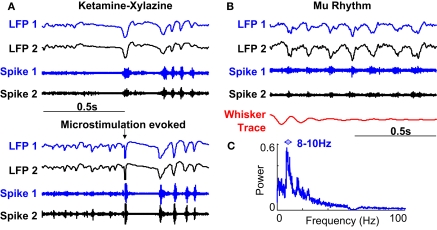
Stimulus-evoked oscillations have been observed in the visual, auditory, olfactory and somatosensory systems. To further our understanding of these oscillations, it is essential to study their occurrence and behavioral modulation in alert, awake animals. Here we show that microstimulation in barrel cortex of alert rats evokes 15-18 Hz oscillations that are strongly modulated by motor behavior. In freely whisking rats, we found that the power of the microstimulation-evoked oscillation in the local field potential was inversely correlated to the strength of whisking. This relationship was also present in rats performing a stimulus detection task suggesting that the effect was not due to sleep or drowsiness. Further, we present a computational model of the thalamocortical loop which recreates the observed phenomenon and predicts some of its underlying causes. These findings demonstrate that stimulus-evoked oscillations are strongly influenced by motor modulation of afferent somatosensory circuits.

Keywords: behavioral modulation; cortical microstimulation; evoked oscillations; thalamocortical.


Figures

Figure 1
Figure 1
Evoked responses to cortical microstimulation. (A) 1–200 Hz local field potential (LFP) and 0.5–10 kHz multiunit activity (Spike) recorded from two electrodes in infragranular layer of barrel cortex of awake rats are shown along with traces of whisker movements. Microstimulation (at 0 s) delivered during active whisking typically induced a small neural response which is partially obscured by the stimulus artifact at 0 s. (B) On the other hand, microstimulation delivered during periods of no whisker movement typically induced a long period of reduced neural activity followed by a series of 15–18 Hz rhythmic oscillations in the LFP and concomitant spike bursts in multiunit recordings.
Figure 2
Figure 2
Correlation between whisking and evoked LFP oscillations. (A) Example LFP trace of microstimulation evoked oscillations. (B) Spectrogram of above LFP trace. The power in the 10–20 Hz band from 100–500 ms after microstimulation is used as a metric of the power of the evoked LFP oscillation (dashed black box). (C) Scatter plot shows an inverse relation between the power of the evoked LFP oscillations and the strength of whisking in 300 stimulations on one rat.
Figure 3
Figure 3
LFP and multiunit evoked responses. (A) Raster plot and average evoked LFP responses to cortical microstimulation (at 0 s) in ‘whisking’ and ‘quiet’ trials. (B) The average power spectral density of the LFP during the period 100–500 ms after microstimulation in whisking and quiet trials. (C) Raster and histogram of evoked multiunit responses to microstimulation during whisking and quiet trials. The quiet trials show a lower baseline firing rate, a prolonged inhibition and oscillatory bursting but the initial excitation (0–5 ms) is similar to that observed when whisking.
Figure 4
Figure 4
Time constant of behavioral states. (A) Example of whisking trace and LFP responses to two closely spaced microstimulations. The time of microstimulation is indicated using black arrows. The significant difference in LFP response shows that evoked responses to microstimulation are rapidly modulated by changes in motor behavior. (B) The correlation between LFP oscillation power and whisking strength is plotted at different time lags with the correlation (R) on the Y-axis and the ‘P’ value of each correlation indicated in red. Note that the correlations are negative with the highest magnitude of correlation (−0.50) occurring at 0 lag. The rapid drop-off in the correlation implies rapid switching of behavioral states.
Figure 5
Figure 5
Behavioral modulation in alert rats. (A) Structure of the variable interval tone detection task on which rats were trained. Cortical microstimulation was introduced 0.5–1 s before the tone stimulus on some trials and had no relevance to the task. (B) The inverse relation between evoked LFP oscillations and whisking strength continued to hold. (C) The raster and (D) power spectral density of evoked oscillations in trials classified as quiet and whisking show clear behavioral modulation of evoked responses.
Figure 6
Figure 6
Amplitude of stimulation. (A) Scatter plot, raster and average of the LFP response to cortical microstimulation at 10 μA. The correlation coefficient between whisking strength and strength of evoked oscillations is denoted by ‘R’ (P < 0.05 in both cases) and slope of the linear fit of the scatter plot is denoted by ‘m’. (B) Neural response to microstimulation at 30 μA shows evoked oscillations irrespective of behavioral state.
Figure 7
Figure 7
Comparison to spontaneous oscillations. (A) Spontaneous waning oscillations in LFP and multiunit recordings while under ketamine-xylazine anesthesia (ketamine spindles) are very similar to microstimulation evoked responses in the same animal. (B) Spontaneous oscillations (SWDs) observed in awake immobile rats often accompanied by whisker twitching. (C) Average frequency spectrum of SWDs shows a peak at 8–10 Hz clearly different from that observed in microstimulation evoked oscillations.
Figure 8
Figure 8
Thalamocortical model. (A) Computational model of the thalamocortical loop used to investigate potential mechanisms of the experimentally observed evoked responses. The green arrows denote excitatory connections and the red arrows inhibitory. (B) Evoked LFP response of the thalamocortical model to a burst of spikes in the cortex (at 0 s) shows a similar response to experimentally observed data. (C) The model suggests that a GABAB mediated IPSP in thalamocortical cells plays a significant role in the initial prolonged inhibition. A series of GABAA mediated IPSPs in thalamic neurons along with their intrinsic bursting properties seem to be responsible for the oscillatory evoked response. (D) The evoked response in the modeled whisking state is similar to that experimentally seen. (E) Application of GABAA antagonists induces lower frequency sustained oscillations in the thalamocortical model.

References

    1. Ahissar E., Derdikman D., Hildesheim R., Arieli A., Grinvald A. (2003). Imaging spatiotemporal dynamics of surround inhibition in the barrels somatosensory cortex. J. Neurosci. 23, 3100–3105 - PMC - PubMed
    1. Bartley H. S., Bishop G. H. (1932). The cortical response to stimulation of the optic nerve in the rabbit. Am. J. Physiol. 103, 159–172
    1. Butovas S., Hormuzdi S. G., Monyer H., Schwarz C. (2006). Effects of electrically coupled inhibitory networks on local neuronal responses to intracortical microstimulation. J. Neurophysiol. 96, 1227–123610.1152/jn.01170.2005 - DOI - PubMed
    1. Butovas S., Schwarz C. (2003). Spatiotemporal effects of microstimulation in rat neocortex: a parametric study using multielectrode recordings. J. Neurophysiol. 90, 3024–303910.1152/jn.00245.2003 - DOI - PubMed
    1. Castro-Alamancos M. A. (2004). Dynamics of sensory thalamocortical synaptic networks during information processing states. Prog. Neurobiol. 74, 213–24710.1016/j.pneurobio.2004.09.002 - DOI - PubMed

LinkOut - more resources