. 2009 May 27:3:14.
doi: 10.3389/neuro.11.014.2009. eCollection 2009.

OpenElectrophy: An Electrophysiological Data- and Analysis-Sharing Framework

Affiliations

OpenElectrophy: An Electrophysiological Data- and Analysis-Sharing Framework

Samuel Garcia et al. Front Neuroinform. .

Abstract

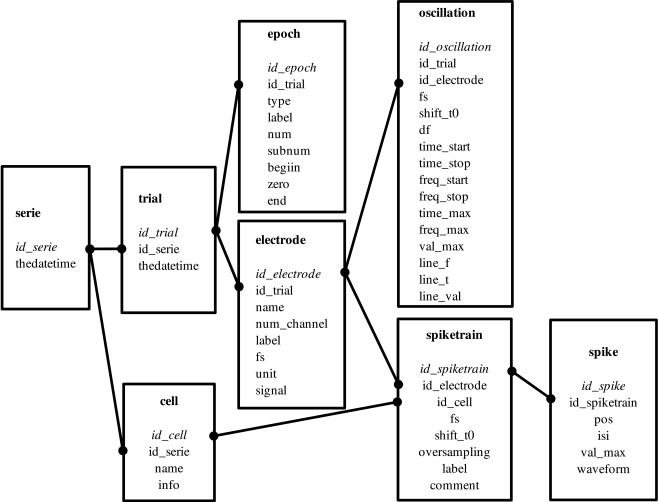
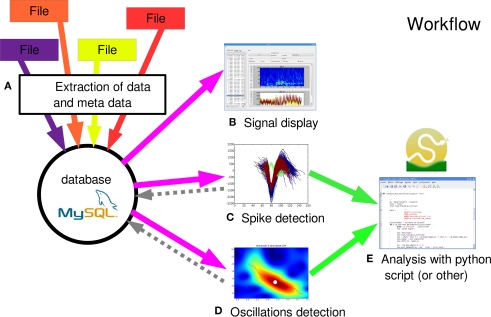
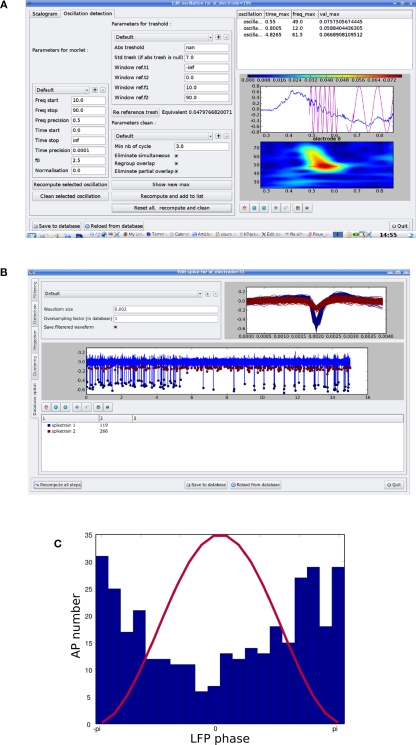
Progress in experimental tools and design is allowing the acquisition of increasingly large datasets. Storage, manipulation and efficient analyses of such large amounts of data is now a primary issue. We present OpenElectrophy, an electrophysiological data- and analysis-sharing framework developed to fill this niche. It stores all experiment data and meta-data in a single central MySQL database, and provides a graphic user interface to visualize and explore the data, and a library of functions for user analysis scripting in Python. It implements multiple spike-sorting methods, and oscillation detection based on the ridge extraction methods due to Roux et al. (2007). OpenElectrophy is open source and is freely available for download at http://neuralensemble.org/trac/OpenElectrophy.

Keywords: SQL; analysis; database; electrophysiology; oscillation; python; spike sorting.


Figures

Figure 1
Figure 1
Database schema. This is a classical relational design. Each frame corresponds to a table that holds all of the properties of an element in its fields. For example, the table spike holds for each spike its own index (id_spike), the index of the spike train it belongs to (id_spiketrain), its position (pos), the maximum amplitude (val_max) and its raw waveform (waveform). All of the tables and fields are natively generated by OpenElectrophy; the schema is flexible and extensible to accommodate specific needs. The core of the schema includes the trial, electrode and epoch tables. A trial is a combination of several simultaneous coherent recordings. These recordings are continuous or discrete, and are stored in the electrode or epoch tables, respectively. Additional tables are as follows. The series table, which gathers a set of trials (e.g., those recorded in the same location). The spike table contains all detected spikes and their positions and shapes. The spikes are grouped according to their spike train (there may be many spike trains per electrode). The cell table groups spike trains that were recorded from the same cell but in different trials; thus, the cell table groups them relationally. Finally, the oscillation table contains all of the information related to transient oscillatory events (see Section “Oscillation Extraction”).
Figure 2
Figure 2
General work flow. The main steps for using OpenElectrophy are: (A) integration of data from a heterogeneous collection of files into the database; (B) exploration and plotting of raw signals directly from the database; (C) extraction of spikes from the raw signals and integration of these spikes into the spike, spiketrain and cell tables; (D) extraction of oscillations and integration of these oscillations into the oscillation table; (E) analysis with Python scripts using OpenElectrophy-specific classes and methods.
Figure 3
Figure 3
(A) Snapshot of the oscillation detection dialog. On the left side, frames encapsulate different kinds of parameters: for the Morlet scalogram, the threshold definition and “cleaning” the detection. On upper right, there is a list of detected oscillations. On lower right, there is a zoomed picture of one time–frequency line, which represents an oscillatory event, and the relative phase reconstruction superimposed on the raw signal. When the detection is done, the results can be stored in the MySQL database. (B) Snapshot of the spike detection dialog. On the left, there are different tabs corresponding to the different steps of spike extraction: filtering, detection, projection and clustering. The result of a particular detection that can be saved into the database is on the shown tab. (C) Example of how spike and oscillatory events can be mixed, showing how a spike train is phase locked on the LFP phase. One oscillation cycle is depicted in red, and a histogram of the phases of spike discharge is shown in blue.

References

    1. Blatt M., Wiseman S., Domany E. (1996). Superparamagnetic clustering of data. Phys. Rev. Lett. 76, 3251–3254 10.1103/PhysRevLett.76.3251 - DOI - PubMed
    1. Hanke M., Halchenko Y.O., Sederberg P. B., Olivetti E., Fründ I., Rieger J.W., Herrmann C. S., Haxby J. V., Hanson S., Pollmann S. (2009). PyMVPA: a unifying approach to the analysis of neuroscientific data. Front. Neuroinform. 3,3. 10.3389/neuro.11.003.2009 - DOI - PMC - PubMed
    1. Ince R. A., Petersen R. S., Swan D. C., Panzeri S. (2009). Python for information theoretic analysis of neural data. Front. Neuroinform. 3,4. 10.3389/neuro.11.004.2009 - DOI - PMC - PubMed
    1. Lewicki M. S. (1998). A review of methods for spike sorting: the detection and classification of neural action potentials. Network 9, R53–R78 - PubMed
    1. Litaudon P., Garcia S., Buonviso N. (2008). Strong coupling between pyramidal cell activity and network oscillations in the olfactory cortex. Neuroscience 156, 781–787 10.1016/j.neuroscience.2008.07.077 - DOI - PubMed

LinkOut - more resources