Higher CO2-insufflation pressure inhibits the expression of adhesion molecules and the invasion potential of colon cancer cells
- PMID: 19522021
- PMCID: PMC2695886
- DOI: 10.3748/wjg.15.2714
Higher CO2-insufflation pressure inhibits the expression of adhesion molecules and the invasion potential of colon cancer cells
Abstract
Aim: To investigate the influence of CO(2)-insufflation pressure on adhesion, invasion and metastatic potential of colon cancer cells based on adhesion molecules expression.
Methods: With an in vitro artificial pneumoperitoneum model, SW1116 human colon carcinoma cells were exposed to CO(2)-insufflation in 5 different pressure groups: 6 mmHg, 9 mmHg, 12 mmHg, 15 mmHg and control group, respectively for 1 h. Expression of E-cadherin, ICAM-1, CD44 and E-selectin was measured at 0, 12, 24, 48 and 72 h after CO(2)-insufflation using flow cytometry. The adhesion and invasion capacity of SW1116 cells before and after exposure to CO(2)-insufflation was detected by cell adhesion/invasion assay in vitro. Each group of cells was injected intraperitoneally into 16 BALB/C mice. The number of visible abdominal cavity tumor nodules, visceral metastases and survival of the mice were recorded in each group.
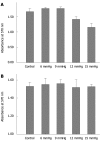
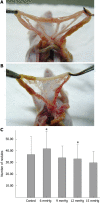
Results: The expression of E-cadherin, ICAM-1, CD44 and E-selectin in SW1116 cells were changed significantly following exposure to CO(2) insufflation at different pressures (P < 0.05). The expression of E-cadherin, CD44 and ICAM-1 decreased with increasing CO(2)-insufflation pressure. The adhesive/invasive cells also decreased gradually with increasing pressure as determined by the adhesion/invasion assay. In animal experiments, the number of abdominal cavity tumor nodules in the 15 mmHg group was also significantly lower than that in the 6 mmHg group (29.7 +/- 9.91 vs 41.7 +/- 14.90, P = 0.046). However, the survival in each group was not statistically different.
Conclusion: CO(2)-insufflation induced a temporary change in the adhesion and invasion capacity of cancer cells in vitro. Higher CO(2)-insufflation pressure inhibited adhesion, invasion and metastatic potential in vitro and in vivo, which was associated with reduced expression of adhesion molecules.
Figures


Similar articles
-
[Impact of pneumoperitoneum on expression of E-cadherin, CD44v6 and CD54 (ICAM-1) on HT-29 colon-carcinoma cells].Zentralbl Chir. 2005 Oct;130(5):405-9. doi: 10.1055/s-2005-836837. Zentralbl Chir. 2005. PMID: 16220435 German.
-
Heated and humidified CO₂ pneumoperitoneum inhibits tumour cell proliferation, migration and invasion in colon cancer.Int J Hyperthermia. 2014 May;30(3):201-9. doi: 10.3109/02656736.2014.898339. Epub 2014 Apr 10. Int J Hyperthermia. 2014. PMID: 24720439
-
Increased expression of P-cadherin mRNA in the mouse peritoneum after carbon dioxide insufflation.Surg Endosc. 2001 Sep;15(9):946-9. doi: 10.1007/s004640090114. Epub 2001 Jun 12. Surg Endosc. 2001. PMID: 11443471
-
Adhesion receptors in malignant transformation and dissemination of gastrointestinal tumors.Recent Results Cancer Res. 1996;142:19-50. doi: 10.1007/978-3-642-80035-1_3. Recent Results Cancer Res. 1996. PMID: 8893333 Review.
-
Tumor malignancy defined by aberrant glycosylation and sphingo(glyco)lipid metabolism.Cancer Res. 1996 Dec 1;56(23):5309-18. Cancer Res. 1996. PMID: 8968075 Review.
Cited by
-
Effect of carbon dioxide pneumoperitoneum on human renal cell carcinoma proliferation and metastasis in an orthotropic xenograft nude mouse model.Arch Med Sci. 2014 Oct 27;10(5):1041-6. doi: 10.5114/aoms.2014.46222. Epub 2014 Oct 23. Arch Med Sci. 2014. PMID: 25395958 Free PMC article.
-
Long-Term Outcomes of Carbon Dioxide Insufflation in Thoracoscopic Esophagectomy After Neoadjuvant Chemotherapy for Esophageal Squamous Cell Carcinoma: A Retrospective Cohort Study.Cureus. 2024 Jul 21;16(7):e65053. doi: 10.7759/cureus.65053. eCollection 2024 Jul. Cureus. 2024. PMID: 39171044 Free PMC article.
-
Expression Level of Genes Coding for Cell Adhesion Molecules of Cadherin Group in Colorectal Cancer Patients.Med Sci Monit. 2015 Jul 13;21:2031-40. doi: 10.12659/MSM.893610. Med Sci Monit. 2015. PMID: 26167814 Free PMC article.
-
Effects of a simulated CO2 pneumoperitoneum environment on the proliferation, apoptosis, and metastasis of cervical cancer cells in vitro.Med Sci Monit. 2014 Dec 1;20:2497-503. doi: 10.12659/MSM.891179. Med Sci Monit. 2014. PMID: 25436974 Free PMC article.
References
-
- Alexander RJ, Jaques BC, Mitchell KG. Laparoscopically assisted colectomy and wound recurrence. Lancet. 1993;341:249–250. - PubMed
-
- Clinical Outcomes of Surgical Therapy Study Group. A comparison of laparoscopically assisted and open colectomy for colon cancer. N Engl J Med. 2004;350:2050–2059. - PubMed
-
- Buunen M, Veldkamp R, Hop WC, Kuhry E, Jeekel J, Haglind E, Pahlman L, Cuesta MA, Msika S, Morino M, et al. Survival after laparoscopic surgery versus open surgery for colon cancer: long-term outcome of a randomised clinical trial. Lancet Oncol. 2009;10:44–52. - PubMed
MeSH terms
Substances
LinkOut - more resources
Full Text Sources
Miscellaneous

