

Review
doi: 10.1021/cr900033p.
Theory, practice, and applications of paramagnetic relaxation enhancement for the characterization of transient low-population states of biological macromolecules and their complexes
Affiliations
- PMID: 19522502
- PMCID: PMC2825090
- DOI: 10.1021/cr900033p
Item in Clipboard
Review
Theory, practice, and applications of paramagnetic relaxation enhancement for the characterization of transient low-population states of biological macromolecules and their complexes
Chem Rev.
2009 Sep.
No abstract available
Figures

Major long-range observables in paramagnetic NMR.
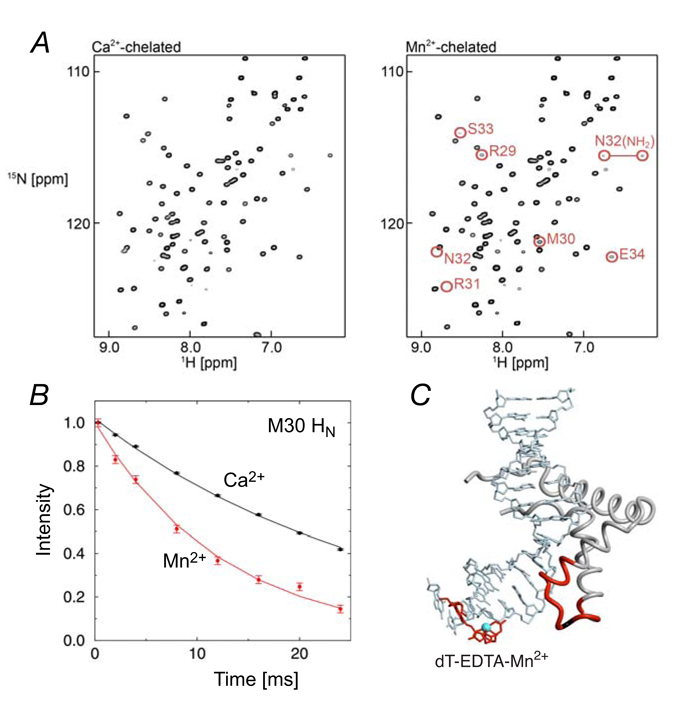
(A) 1H-15N HSQC spectra recorded on SRY/DNA-EDTA complexes (Right, Mn2+-chelated; left, Ca2+-chelated). Note that the cross-peak locations for the diamagnetic (Ca2+) and paramagnetic (Mn2+) states are identical. (B) 1H transverse relaxation for Met-30 in the SRY/DNA-EDTA complexes (red, Mn2+-chelated; black, Ca2+-chelated). (C) Location of dT-EDTA-Mn2+ in the complex. Protein residues that exhibit a PRE 1HN-Γ2 rate larger than 15 s−1 are colored in red. Adapted from Iwahara et al. published in J. Am. Chem. Soc. (American Chemical Society) while the authors were US Government employees at the National Institutes of Health.

Influence of the correlation time τi for internal motion on (A) 1H-Γ1 and (B) 1H-Γ2 rates at 500 MHz. The vertical axis displays the Γ/Γ0 ratio, where Γ is calculated with the full SBMF equation (Eq. 12) and Γ0 with only the first term of the SBMF equation. Γ0 corresponds to Γ when τi→0. Curves, calculated with the correlation time set to 3 ns, are shown with three different values of the order parameter S2 for PRE interaction vectors: S2MnH = 0.9 (solid line), 0.7 (dashed line) and 0.5 (long-short dashed line). The dependence of the 1H-Γ1 and 1H-Γ2 rates on τi are field-dependent and the maximum of the 1H-Γ1/1H-Γ10 curve is located around τi ~ 1/ωI Adapted from Iwahara et al. published in J. Am. Chem. Soc. (American Chemical Society) while the authors were US Government employees at the National Institutes of Health.

PRE-based amplification of information on low population states. (A) Two site exchange system comprising a major species A (99%) and a minor species B (1%). (B) Lineshape simulation of the resonance of species A illustrating the effect of exchange on the apparent PRE Γ2app rate. When the exchange rate kex is fast, the apparent PRE Γ2app rate can be dominated by the invisible minor state even though its population is as small as 1%. In these simulations, the intrinsic relaxation rates for species A and B were set to 50 s−1 for the diamagnetic state. The resonances arising from species A and B are located at −50 and 50 Hz, respectively. The chemical shifts for the diamagnetic and paramagnetic are assumed to be identical since a paramagnetic system with an isotropic electron g-tensor such as Mn2+ does not generate a pseudo-contact shift. Adapted from Iwahara et al. published in Nature (Nature Publishing Group) while the authors were US Government employees at the National Institutes of Health.
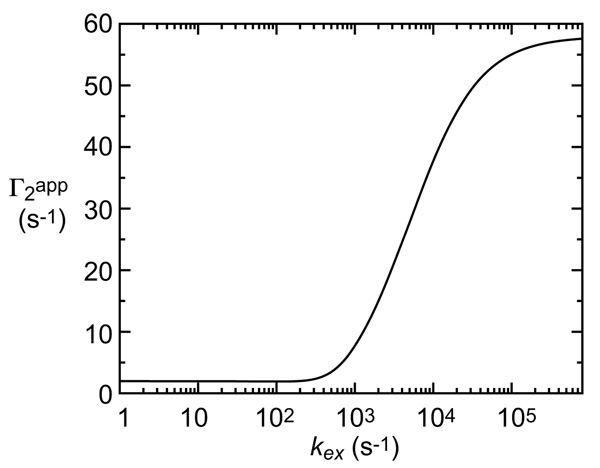
Relationship between exchange rate kex and apparent PRE Γ2app rate for the two-state exchange system shown in Figure 4.

Relationships between chemical shift difference |ΩA−ΩB| and apparent PRE Γ2app rate for the two-state exchange system in Figure 4.
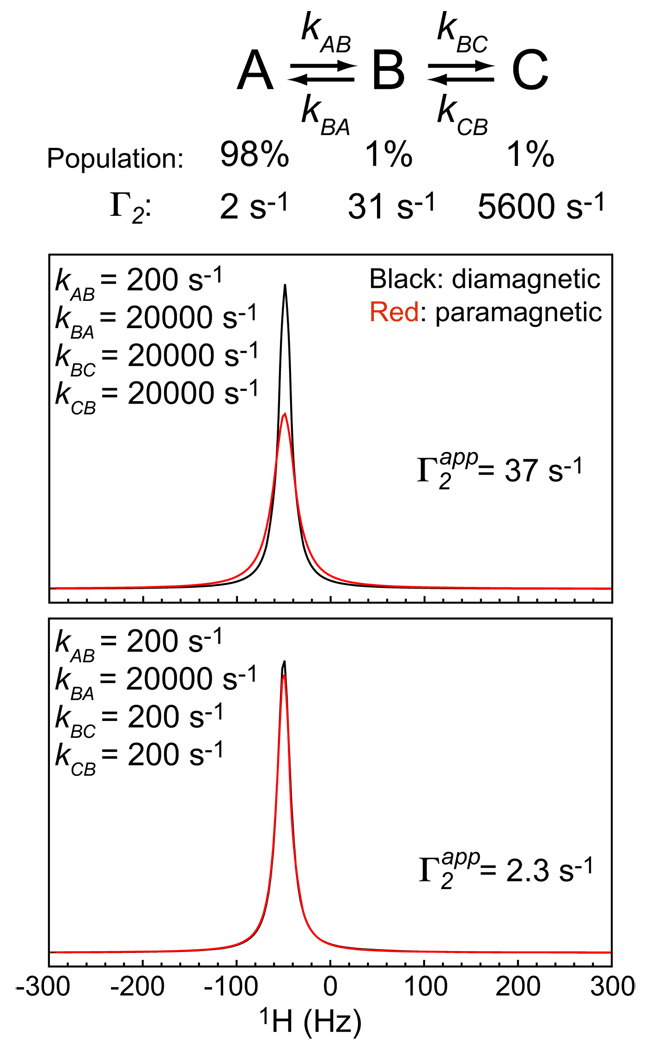
PRE simulations for a consecutive three-state exchange system.

Three types of PRE. (A) Intramolecular PREs arising from the paramagnetic group within the same molecule. (B) Intermolecular PREs arising from the paramagnetic group located on the interaction partner. (C) Solvent PREs arising from random collisions between a macromolecule and paramagnetic co-solute molecules.

Paramagnetic probes for protein labeling at a surface exposed cysteine residue. (1) MTSSL,, (2) Iodoacetamido-PROXYL,102 (3) Iodoacetamido-TEMPO, (4) Maleimide-TEMPO,, (5) S-(2-pyridylthio)cysteaminyl-EDTA,,, (6) MTS-EDTA, and (7) CLaNP-5.2., These compounds are conjugated to a cysteine thiol group (Compounds 2–4 can also react with other types of amino acids, depending on reaction conditions). Gray-colored groups are replaced with a cysteine Sγ atom after conjugation. For maleimide-TEMPO (compound 4), the C=C double bond becomes a single bond and the cysteine Sγ atom is bonded to one of the carbon atoms. Compound 7 is conjugated to two cysteine residues in close spatial proximity on the surface of the protein. For the metal chelators (compounds 5–7), atoms involved in metal coordination are indicated by an asterisk.

EDTA-derivatized DNA bases.,, These modified bases can be incorporated at any desired position by solid-phase DNA synthesis.

Nitroxide-derivatives of DNA/RNA bases.,–

Co-solute paramagnetic probes for investigations of molecular surface.

Pulse sequence for the measurement of PRE Γ2 rates on HN protons. Details are given in Iwahara et al. published in J. Magn. Reson (Elsevier) while the authors were US Government employees at the National Institutes of Health.

Comparison of 1H-Γ2 rates obtained from a simple two-time point measurement versus a conventional eight-time point measurement. Adapted from Iwahara et al. published in J. Magn. Reson (Elsevier) while the authors were US Government employees at the National Institutes of Health.

Pulses sequences for the measurement of PRE Γ2 rates on (A) 1Ha directly bonded to 13C and (B) all other 13C-attached protons. Details are given in supporting information of Iwahara et al. published in J. Am. Chem. Soc. (American Chemical Society) while the authors were US Government employees at the National Institutes of Health.

Error in PRE Γ2 as function of ΔT in two-time point measurement. Adapted from Iwahara et al. published in J. Magn. Reson. (Elsevier) while the authors were US Government employees at the National Institutes of Health.
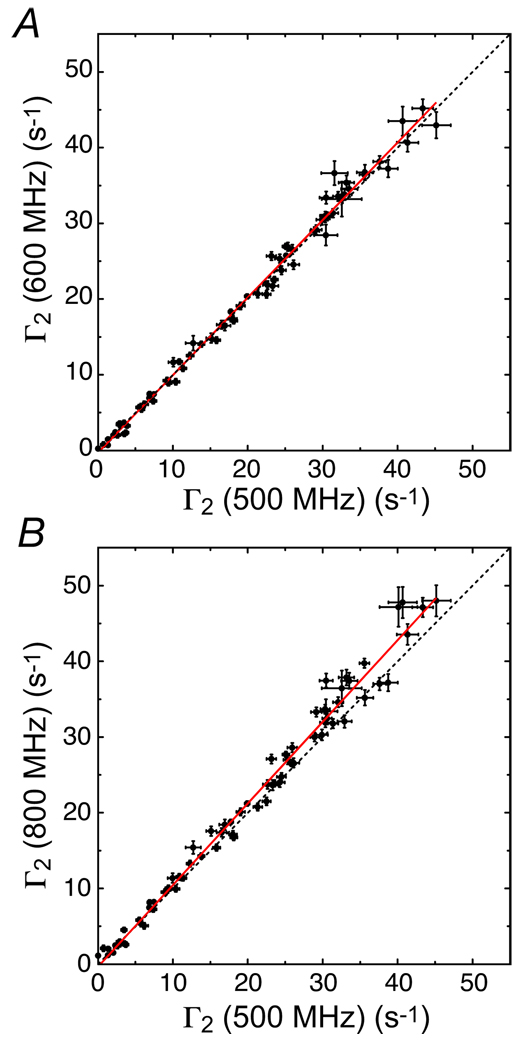
Field-dependence of 1H-Γ2 rates arising from dT-EDTA-Mn2+ in the SRY/DNA-EDTA-Mn2+ complex. Adapted from Iwahara et al. published in J. Magn. Reson. (Elsevier) while the authors were US Government employees at the National Institutes of Health.

Theoretical effect of diamagnetic impurities on the measurement of 1H-Γ2 rates. Adapted from Iwahara et al. published in J. Magn. Reson (Elsevier) while the authors were US Government employees at the National Institutes of Health.

Experimentally observed effect of diamagnetic impurities on 1H-Γ2 rate measurements. Adapted from Iwahara et al. published in J. Magn. Reson (Elsevier) while the authors were US Government employees at the National Institutes of Health.

Correlation between observed and calculated PRE 1H-Γ2 rates for the NMR structure of the SRY-DNA complex. The experimental data comprise PREs collected for the EDTA-Mn2+ paramagnetic label at three different sites, one at a time. Each paramagnetic labels was represented by a three-conformer ensemble. Adapted from Iwahara et al. published in J. Am. Chem. Soc. (American Chemical Society) while the authors were US Government employees at the National Institutes of Health.

Otting-LeMaster, approach for predicting solvent PREs from structure. For the prediction, distances from a 1H nucleus to grid points that can be occupied by co-solute molecules are calculated and used in Eq. [35].

Comparison of observed and calculated solvent PRE profiles for the HoxD9 homeodomain free in solution and bound to DNA in specific and non-specific complexes. (A) Experimental solvent PRE profiles for free HoxD9 (black) and HoxD9 bound specifically (red) and non-specifically (green) to DNA. (B) Predicted solvent PREs ratios for free to specifically bound HoxD9 calculated using the Otting-LeMaster approach. (C) Experimentally observed solvent PRE ratios for free to non-specifically bound HoxD9. (D) Experimentally observed solvent PRE ratios for free to specifically bound HoxD9. Adapated from Iwahara et al. published in Proc. Natl. Acad. Sci. U. S. A. (National Academy of Sciences) while the authors were US Government employees at the National Institutes of Health.

NMR characterization of the HMGB-1A/DNA non-specific complex. (A) 1H-15N correlation spectrum of U-[15N/13C]-HMGB-1A in the presence of a 14-bp DNA duplex (natural isotopic abundance) at a ratio of 1:1.5 protein to DNA to ensure that all protein is bound and only a single molecule of protein is bound per 14-bp DNA duplex. (B) The 1H-15N correlation spectrum does not permit one to distinguish between a single binding mode (top) and multiple binding modes in rapid exchange with one another (bottom). Adapted from Iwahara et al. published in J. Am. Chem. Soc. (American Chemical Society) while the authors were US Government employees at the National Institutes of Health.

PRE characterization of HMGB-1A binding non-specifically to DNA. (A) Comparison of the intermolecular PRE profiles observed for the non-specific HMGB-1A/DNA complex (top) and the specific SRY/DNA complex (bottom) with two DNA duplexes bearing the dT-EDTA-Mn2+ paramagnetic label at the two ends of the DNA. A diagrammatic depiction of the states giving rise to the observed PREs is shown on the right-hand side of the figure. (B) Semi-quantitative analysis of the intermolecular PRE data used to estimate the distribution and occupancy of HMGB-1A binding sites along a 14-bp DNA duplex. There are a total of 13 potential intercalation sites for Phe-37 and HMGB-1A can bind in two orientations related by a 180° rotation (top left panel) giving rise to a total of 26 states. Minimization of the χ2 function shown in Eq. [36] results in a PRE Q-factor of 0.36 (top right panel) with optimized distributions for the two orientations shown in the bottom two panels. Adapted from Iwahara et al. published in J. Am. Chem. Soc. (American Chemical Society) while the authors were US Government employees at the National Institutes of Health.

Intermolecular PREs observed for the specific HoxD9/DNA complex in low and high salt corresponding to slow and fast exchange regimes on the PRE relaxation time scale, respectively, for the interconversion between the specific complex and lowly-populated (<1%) non-specific complexes. (A) 24-bp DNA duplex with the specific site centrally located (boxed) and the location of the 4 paramagnetic labels (one at a time) indicated. (B) Diagrammatic representation of the specific complex (left) and the target search process whereby the specific complex is located (right). (C ) and (D) Correlation between observed and calculated PREs for all 4 sites at low (20 mM NaCl) and high (160 mM) NaCl), respectively. The calculated rates are obtained from a model derived from the crystal structure of the Antennapedia homeodomain/DNA complex. (E) and (F) Intermolecular PRE profiles observed at low (20 mM NaCl) and high (100 and 160 mM NaCl), respectively. The PRE data are mapped on the structural model of the specific complex, with the color coding depicting the observed PRE rates. Adapted from Iwahara et al. published in Nature (Nature Publishing Group) while the authors were US Government employees at the National Institutes of Health.

Assessing the contributions of intramolecular sliding and intermolecular translocation for the HoxD9/DNA complex. (A) PRE data were collected on two samples comprising an equimolar concentration of specific and non-specific DNA duplexes with the paramagnetic label attached to the end of the non-specific duplex in sample 1 and to the end of the specific duplex in sample 2. The location of the specific site and the paramagnetic label are indicated in blue and red, respectively. (B) PRE profiles observed for samples 1 (blue) and 2 (red) are shown in the top panel, and the ratio of the observed PRE rates for the two samples is shown in the bottom panel. (C) Schematic representation of sliding along the DNA starting from the specific site with HoxD9 colored according to the Γ2(sample 2)/Γ2(sample 1) ratio. Adapted from Iwahara et al. published in Nature (Nature Publishing Group) while the authors were US Government employees at the National Institutes of Health.

Schematic representation of protein-protein association with the initial binding event involving the formation of an ensemble of encounter complexes that subsequently relax to the stereospecific complex. The two proteins are displayed in red and blue with the respective interaction surfaces for the stereospecific complex shown in white and yellow. Adapted from Suh et al. published in J. Am. Chem. Soc. (American Chemical Society) while the authors were US Government employees at the National Institutes of Health.

PREs observed for the EIN-HPR complex with EDTA-Mn2+ conjugated to an engineered surface cysteine residue at three separate sites (E5C, E25C and E32C). (A) Correlation between observed and calculated intermolecular Γ2 rates for HPr within the EIN-HPr complex. (B) Correlation between observed and calculated intermolecular Γ2 rates measured on EIN arising from paramagnetically labeled HPr. (C) Intermolecular PRE profiles observed for the three paramagnetically labeled sites, with the experimental Γ2 rates shown as red circles, and the expected Γ2 rates calculated from the structure of the stereospecific complex42 denoted by the black line. The insets depict ribbon diagrams of the complex showing the paramagnetic label (with the distribution of Mn2+ displayed as an ensemble of three red balls) on HPr and the location on EIN of intermolecular PREs that display significant discrepancies between observed and calculated values (with color coding of the difference ΔΓ2 between observed and calculated Γ2 rates shown at the top of the figure). Adapted from Tang et al. published in Nature (Nature Publishing Group) while the authors were US Government employees at the National Institutes of Health.

Semi-quantitative depiction of the non-specific encounter complex ensemble of EIN-HPr. (A) The representation used for rigid body ensemble refinement comprises an equilibrium mixture of the stereospecific complex (whose structure is known and fixed) and a non-specific encounter complex ensemble of size N in rapid exchange with one another. The overall calculated Γ2 rate is a population weighted average of the Γ2 rates of the species present in solution. (B) Dependence of the working (Qe and Qee) and complete cross-validated (Qfree) PRE Q-factors on ensemble size N at a population of 10% for the encounter complex ensemble. (Qe is the average Q-factor for all 100 calculated ensembles, and Qee is the ensemble of ensembles average Q-factor.) Complete cross-validation shows that the optimal size of N lies between 10 and 20. (C) Dependence of the working Q factors on population of the encounter complex ensemble for an ensemble size of N = 20. (D) Correlation between observed and calculated intermolecular Γ2 rates for N = 20 and a population of 10% for the encounter complex ensemble. (E) Two views depicting the atomic probability distribution of the encounter complex ensemble of HPr (green mesh plotted at a threshold of 20% maximum and calculated from 100 independent calculations of ensemble size N = 20 at a population of 10%) on the molecular surface of EIN (color coded by electrostatic potential, ± 8 kT) with the location of HPr in the stereospecific complex shown as a blue ribbon. Adapted from Tang et al.27 published in Nature (Nature Publishing Group) while the authors were US Government employees at the National Institutes of Health.

Differential salt dependence of intermolecular PREs attributable to the stereospecific EIN-HPR complex and the non-specific encounter complex ensemble. (A) Correlation of intermolecular Γ2 rates arising from the stereospecific complex (left-hand panels) and the ensemble of non-specific encounter complexes (right-hand panels) at 0.15 (red), 0.3 (green) and 0.5 (blue) M NaCl versus the corresponding Γ2 rates at 0M NaCl for EIN-HPr(E5C) and EIN-HPr(E25C) paramagnetically labeled with EDTA-Mn2+. The residues for which the observed Γ2 rates are in agreement with those back-calculated on the basis of the stereospecific complex are attributed to the stereospecific complex (residues 115–125 for the EIN/E5C–HPr complex, and residues 40–80 and 127–135 for the EIN/E25C–HPr complex, while the remainder are considered to originate primarily from the ensemble of non-specific encounter complexes (residues 58–91 for the EIN/E5C–HPr complex, and residues 89–92 and 107–123 for the EIN/E25C–HPr complex) (cf. Figure 28C).. (B) Ionic strength dependence of the Kdiss for the EIN-HPr complex determined by isothermal titration calorimetry (left-hand panel) and dependence of the slopes of the Γ2(NaCl) versus Γ2(0 M NaCl) correlations (from panel A) versus the normalized bound population pbound(NaCl)/pbound (0 M NaCl) of stereospecific complex. Adapted from Suh et al. published in J. Am. Chem. Soc. (American Chemical Society) while the authors were US Government employees at the National Institutes of Health.

Observed and calculated intermolecular PREs for the IIAMtl-HPr (panels A-D) and IIAMan-HPr (panels E-H) complexes with HPr paramagnetically labeled with EDTA-Mn2+ at position E5C. A comparison of the observed PRE profiles (red circles) with those back-calculated from the structures of the stereospecific complexes (black lines) are shown in (A) and (E). Structures of the two stereospecific complexes color coded according to the difference, ΔΓ2, between observed and calculated intermolecular Γ2 rates are shown in (B) and (F). Residues of IIAMtl (C) and IIAMan (G) that display a large ΔΓ2 are colored in cyan on a molecular surface representation, with HPr shown as a green ribbon; corresponding electrostatic potential isosurfaces (± 5 kT) are shown in (D) and (H), respectively, using the same views. Adapted from Tang et al. published in Nature (Nature Publishing Group) while the authors were US Government employees at the National Institutes of Health.

Ultra-weak self association of HPr. (A) Intermolecular PRE profiles with EDTA-Mn2+ at positions E5C (top) and E32C (bottom panel). The location of the intermolecular PREs is shown in the insets. (B) Correlation between observed and calculated PREs with the self-associated state represented by an ensemble of size N = 4 at a population of 1%. (C) Reweighted atomic probability density maps (green mesh, plotted at threshold of 20% maximum) showing the distribution of 15N-labeled HPr on the surface of paramagnetically labeled HPr (left panel) and of paramagnetically-labeled HPr on the surface of 15N-labeled HPr (right panel with residues experiencing large intermolecular PREs colored in red, green, blue and yellow using the same color scheme as in (A)). Adapted from Tang et al. published in J. Am. Chem. Soc. (American Chemical Society) while the authors were US Government employees at the National Institutes of Health.

PRE investigation of transient events involved in N-terminal auto-processing of the SFNFPRD25N HIV-1 protease mini-precursor. (A) Intermolecular PRE profiles observed with nitroxide labels at positions T12C and V82C located at the periphery of the substrate binding cleft and dimer interface of the mature protease. The observed Γ2 rates are shown as red circles, the calculated Γ2 rates (derived from ensemble rigid body simulated annealing calculations) for a N = 4 representation for the ensemble of self self-associated states at a population of 5% are shown as black lines (PRE Q-factor = 0.22); and the Γ2 rates back-calculated from the structure of the mature protease at populations of 1 and 2% are shown as blue and green lines, respectively. (B) PRE profiles observed with the nitroxide spin label attached at the N-terminus of SFNFPRD25N with intermolecular PREs (obtained from a mixed sample of 15N-labeled precursor and nitroxide-labeled precursor) shown in red and the sum of intra- and intermolecular PREs (obtained from a sample comprising dual 15N- and nitroxide labeled mini-precursor) in blue. (C) Atomic probability density map (grey mesh plotted at a threshold of 20% of maximum) showing the distribution of the spin-labeled (T12C, E34C and V82C) subunit relative to the isotopically labeled subunit (red ribbon) in the SFNFPRD25N encounter complexes, with the location of the second subunit in the mature protease shown as a blue ribbon. (D) Inter- and intramolecular PREs with Γ2 rates > 10 s−1 color-coded in red and blue, respectively, onto the molecular surface of the mature protease dimer originating from the N-terminal spin-label. Adapted from Tang et al. published in Nature (Nature Publishing Group) while the authors were US Government employees at the National
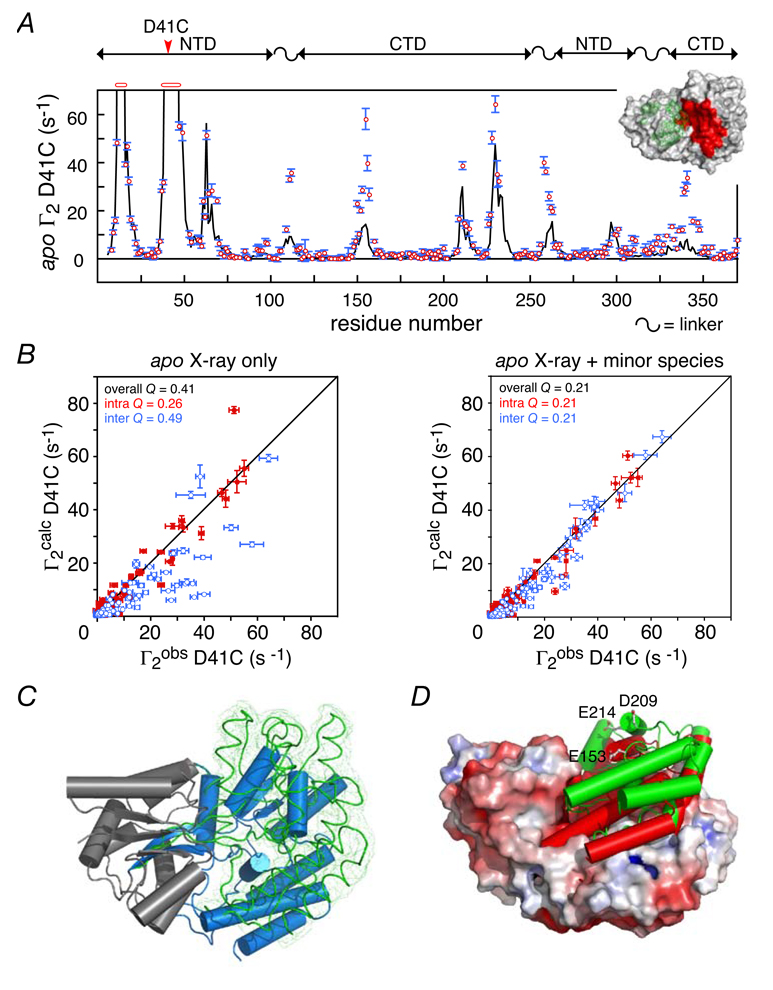
Dynamic interconversion between major open and minor, partially-closed states of apo MBP. (A) Comparison of the observed PRE profile for apo MBP spin-labeled at position D41C (red circles) with that back-calculated on the basis of the apo crystal structure (open state). (B) Correlation between observed and calculated Γ2 rates for the D41C data obtained with the apo crystal structure alone (left panel) and upon inclusion of a minor, partially-closed species at an occupancy of 5% (right panel) derived by conjoined rigid body/torsion angle simulated annealing refinement. (C) Comparison of the major open (blue cylinder) and minor partially-cosed (green smoothed backbone trace with reweighted atomic probability map shown as a green mesh) forms of the CTD of apo MBP with the NTD of the two species superimposed (grey ribbon). (D) Comparison of the relative orientation of the CTD in the minor partially-closed state of apo MBP (green cylinder) and the holo crystal structure (closed state) of MBP (red cylinders) with the crystal structure (open state) of apo MBP shown as a molecular surface color-coded according to electrostatic potential. Adapted from Tang et al. published in Nature (Nature Publishing Group) while the authors were US Government employees at the National Institutes of Health.
References
-
- Branden C, Tooze J. Introduction to Protein Structure. 2nd ed. New York: Garland Publishing Inc; 1998.
-
- Bryngelson JD, Onuchic JN, Socci ND, Wolynes PG. Proteins. 1995;21:167. - PubMed
-
- Onuchic JN, Luthey-Schulten Z, Wolynes PG. Annu. Rev. Phys. Chem. 1997;48:545. - PubMed
-
- Miyashita O, Wolynes PG, Onuchic JN. J. Phys. Chem. B. 2005;109:1959. - PubMed
Publication types
MeSH terms
Substances
Grants and funding
LinkOut - more resources
Full Text Sources
Other Literature Sources
